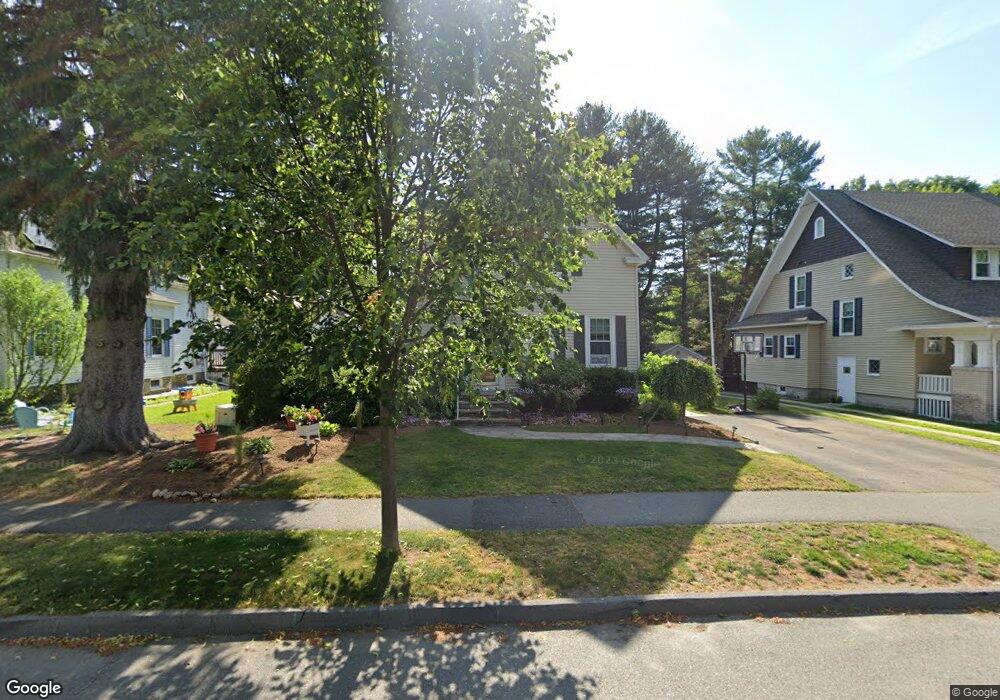
14 Vassar St Worcester, MA 01602
Newton Square NeighborhoodEstimated Value: $510,935 - $528,000
3
Beds
2
Baths
1,677
Sq Ft
$308/Sq Ft
Est. Value
About This Home
This home is located at 14 Vassar St, Worcester, MA 01602 and is currently estimated at $517,234, approximately $308 per square foot. 14 Vassar St is a home located in Worcester County with nearby schools including Chandler Magnet, Jacob Hiatt Magnet School, and Flagg Street School.
Ownership History
Date
Name
Owned For
Owner Type
Purchase Details
Closed on
Jul 31, 2017
Sold by
Doherty Patricia A
Bought by
Moran Amanda M and Moran Brenda J
Current Estimated Value
Home Financials for this Owner
Home Financials are based on the most recent Mortgage that was taken out on this home.
Original Mortgage
$263,150
Outstanding Balance
$219,281
Interest Rate
3.91%
Mortgage Type
New Conventional
Estimated Equity
$297,953
Purchase Details
Closed on
Jun 26, 2015
Sold by
Doherty John A
Bought by
Doherty Patricia A
Purchase Details
Closed on
Jun 24, 2015
Sold by
Ober Megan D
Bought by
Doherty John A and Doherty Patricia A
Purchase Details
Closed on
Apr 6, 2012
Sold by
Doherty Patricia A and Doherty John A
Bought by
Doherty Ft and Doherty John A
Create a Home Valuation Report for This Property
The Home Valuation Report is an in-depth analysis detailing your home's value as well as a comparison with similar homes in the area
Home Values in the Area
Average Home Value in this Area
Purchase History
| Date | Buyer | Sale Price | Title Company |
|---|---|---|---|
| Moran Amanda M | $283,000 | -- | |
| Doherty Patricia A | -- | -- | |
| Doherty John A | -- | -- | |
| Ober Megan D | -- | -- | |
| Doherty Ft | -- | -- |
Source: Public Records
Mortgage History
| Date | Status | Borrower | Loan Amount |
|---|---|---|---|
| Open | Moran Amanda M | $263,150 |
Source: Public Records
Tax History Compared to Growth
Tax History
| Year | Tax Paid | Tax Assessment Tax Assessment Total Assessment is a certain percentage of the fair market value that is determined by local assessors to be the total taxable value of land and additions on the property. | Land | Improvement |
|---|---|---|---|---|
| 2025 | $6,108 | $463,100 | $117,600 | $345,500 |
| 2024 | $5,814 | $422,800 | $117,600 | $305,200 |
| 2023 | $5,608 | $391,100 | $102,300 | $288,800 |
| 2022 | $5,191 | $341,300 | $81,800 | $259,500 |
| 2021 | $5,107 | $313,700 | $65,400 | $248,300 |
| 2020 | $4,835 | $284,400 | $65,400 | $219,000 |
| 2019 | $4,824 | $268,000 | $58,800 | $209,200 |
| 2018 | $3,916 | $207,100 | $58,800 | $148,300 |
| 2017 | $3,748 | $195,000 | $58,800 | $136,200 |
| 2016 | $3,716 | $180,300 | $42,800 | $137,500 |
| 2015 | $3,619 | $180,300 | $42,800 | $137,500 |
| 2014 | -- | $179,800 | $42,800 | $137,000 |
Source: Public Records
Map
Nearby Homes