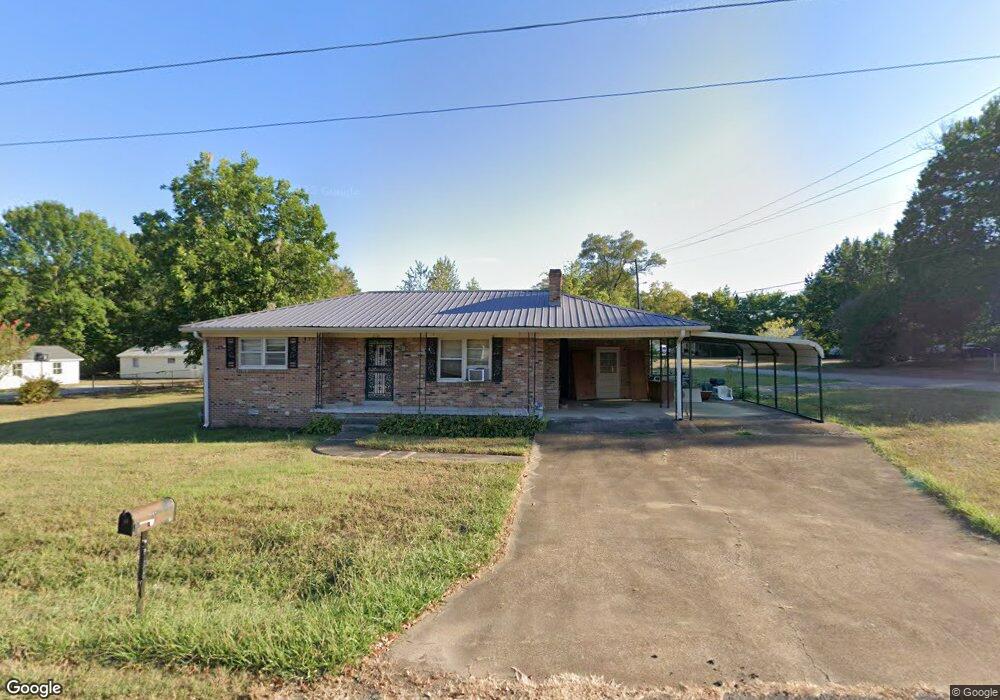
14 Vine St Savannah, TN 38372
Estimated Value: $122,199 - $204,000
--
Bed
1
Bath
926
Sq Ft
$160/Sq Ft
Est. Value
About This Home
This home is located at 14 Vine St, Savannah, TN 38372 and is currently estimated at $148,550, approximately $160 per square foot. 14 Vine St is a home located in Hardin County with nearby schools including Hardin County High School and Hardin County Christian School.
Ownership History
Date
Name
Owned For
Owner Type
Purchase Details
Closed on
Aug 22, 2024
Sold by
Morris Trevor William and Morris Patrick Jerome
Bought by
Johnson Adam
Current Estimated Value
Purchase Details
Closed on
Feb 16, 2005
Sold by
Morris Joyce
Bought by
Morris Joyce
Purchase Details
Closed on
Sep 9, 1997
Sold by
Dicus Jerry Lynn and Dicus Brenda
Bought by
Morris William
Purchase Details
Closed on
Oct 29, 1987
Bought by
Dicus Jerry Lynn and Dicus Brenda
Purchase Details
Closed on
Jul 19, 1982
Bought by
Parker Goldia M
Create a Home Valuation Report for This Property
The Home Valuation Report is an in-depth analysis detailing your home's value as well as a comparison with similar homes in the area
Home Values in the Area
Average Home Value in this Area
Purchase History
| Date | Buyer | Sale Price | Title Company |
|---|---|---|---|
| Johnson Adam | $90,000 | None Listed On Document | |
| Morris Joyce | -- | -- | |
| Morris William | $43,300 | -- | |
| Dicus Jerry Lynn | $30,500 | -- | |
| Parker Goldia M | -- | -- |
Source: Public Records
Tax History Compared to Growth
Tax History
| Year | Tax Paid | Tax Assessment Tax Assessment Total Assessment is a certain percentage of the fair market value that is determined by local assessors to be the total taxable value of land and additions on the property. | Land | Improvement |
|---|---|---|---|---|
| 2024 | $830 | $33,900 | $2,625 | $31,275 |
| 2023 | $830 | $33,900 | $2,625 | $31,275 |
| 2022 | $466 | $16,875 | $2,625 | $14,250 |
| 2021 | $466 | $16,875 | $2,625 | $14,250 |
| 2020 | $466 | $16,875 | $2,625 | $14,250 |
| 2019 | $466 | $16,875 | $2,625 | $14,250 |
| 2018 | $454 | $16,875 | $2,625 | $14,250 |
| 2017 | $467 | $16,800 | $2,625 | $14,175 |
| 2016 | $467 | $16,800 | $2,625 | $14,175 |
| 2015 | $423 | $16,800 | $2,625 | $14,175 |
| 2014 | $423 | $16,800 | $2,625 | $14,175 |
Source: Public Records
Map
Nearby Homes