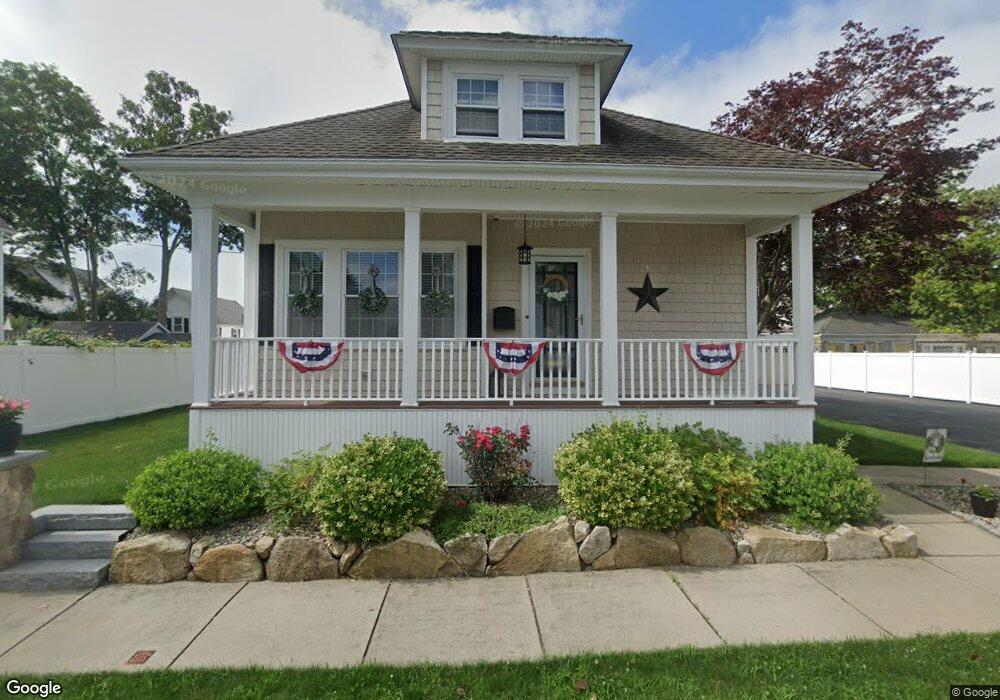
14 Weaver St New Bedford, MA 02740
The South End NeighborhoodEstimated Value: $410,000 - $462,000
2
Beds
1
Bath
1,366
Sq Ft
$324/Sq Ft
Est. Value
About This Home
This home is located at 14 Weaver St, New Bedford, MA 02740 and is currently estimated at $442,650, approximately $324 per square foot. 14 Weaver St is a home located in Bristol County with nearby schools including James B. Congdon Elementary, Roosevelt Middle School, and New Bedford High School.
Ownership History
Date
Name
Owned For
Owner Type
Purchase Details
Closed on
Sep 22, 2010
Sold by
Marinho Susan J and Marinho Roger M
Bought by
Marshall Jason A and Marshall Elena S
Current Estimated Value
Home Financials for this Owner
Home Financials are based on the most recent Mortgage that was taken out on this home.
Original Mortgage
$176,000
Outstanding Balance
$116,454
Interest Rate
4.48%
Mortgage Type
Purchase Money Mortgage
Estimated Equity
$326,196
Purchase Details
Closed on
May 12, 2005
Sold by
Moore Marie
Bought by
Marinho Roger M and Marinho Susan J
Home Financials for this Owner
Home Financials are based on the most recent Mortgage that was taken out on this home.
Original Mortgage
$127,800
Interest Rate
6.05%
Mortgage Type
Purchase Money Mortgage
Create a Home Valuation Report for This Property
The Home Valuation Report is an in-depth analysis detailing your home's value as well as a comparison with similar homes in the area
Home Values in the Area
Average Home Value in this Area
Purchase History
| Date | Buyer | Sale Price | Title Company |
|---|---|---|---|
| Marshall Jason A | $225,000 | -- | |
| Marshall Jason A | $225,000 | -- | |
| Marinho Roger M | $79,900 | -- | |
| Marinho Roger M | $79,900 | -- | |
| Marinho Roger M | $79,900 | -- |
Source: Public Records
Mortgage History
| Date | Status | Borrower | Loan Amount |
|---|---|---|---|
| Open | Marinho Roger M | $176,000 | |
| Closed | Marinho Roger M | $176,000 | |
| Previous Owner | Marinho Roger M | $127,800 |
Source: Public Records
Tax History Compared to Growth
Tax History
| Year | Tax Paid | Tax Assessment Tax Assessment Total Assessment is a certain percentage of the fair market value that is determined by local assessors to be the total taxable value of land and additions on the property. | Land | Improvement |
|---|---|---|---|---|
| 2025 | $4,754 | $420,300 | $112,800 | $307,500 |
| 2024 | $4,540 | $378,300 | $108,800 | $269,500 |
| 2023 | $4,579 | $320,400 | $91,000 | $229,400 |
| 2022 | $4,294 | $276,300 | $88,600 | $187,700 |
| 2021 | $4,814 | $263,700 | $84,600 | $179,100 |
| 2020 | $4,019 | $248,700 | $84,600 | $164,100 |
| 2019 | $3,821 | $232,000 | $84,600 | $147,400 |
| 2018 | $9,056 | $217,300 | $84,600 | $132,700 |
| 2017 | $3,431 | $205,600 | $86,600 | $119,000 |
| 2016 | $3,311 | $200,800 | $86,600 | $114,200 |
| 2015 | $3,075 | $195,500 | $86,600 | $108,900 |
| 2014 | $2,733 | $180,300 | $86,600 | $93,700 |
Source: Public Records
Map
Nearby Homes