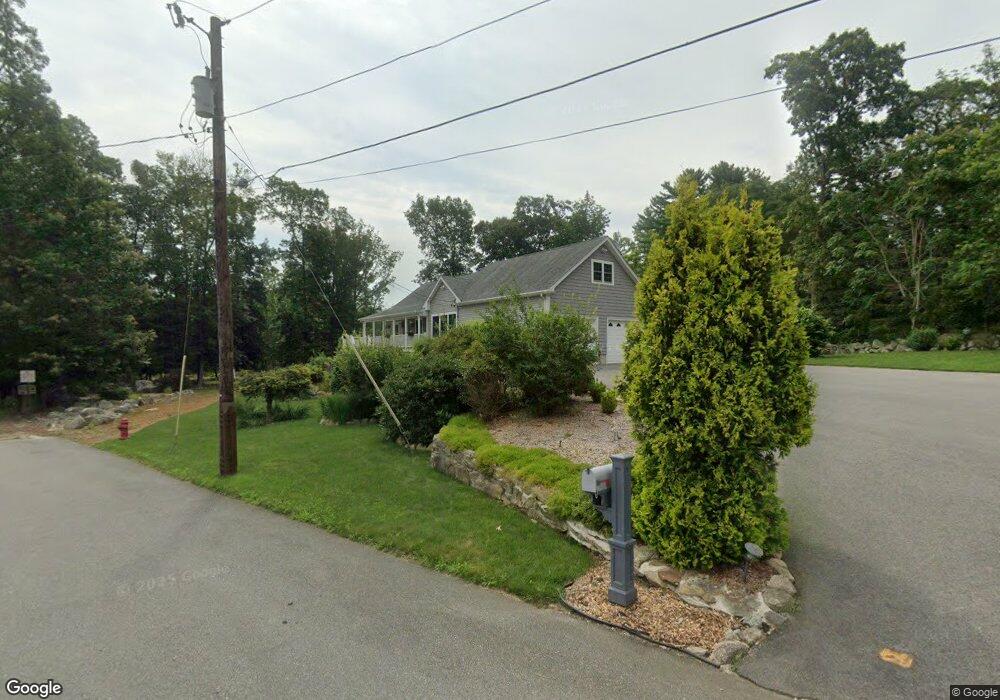
14 Whelden Ln Acushnet, MA 02743
Sherwood Forest NeighborhoodEstimated Value: $595,000 - $816,000
3
Beds
2
Baths
3,010
Sq Ft
$237/Sq Ft
Est. Value
About This Home
This home is located at 14 Whelden Ln, Acushnet, MA 02743 and is currently estimated at $713,294, approximately $236 per square foot. 14 Whelden Ln is a home located in Bristol County with nearby schools including Acushnet Elementary School, Albert F Ford Middle School, and All Saints Catholic School.
Ownership History
Date
Name
Owned For
Owner Type
Purchase Details
Closed on
Sep 8, 2015
Sold by
Avylla 3Rd Thomas F and Avylla Donna
Bought by
Avylla Ft and Avylla Thomas F
Current Estimated Value
Purchase Details
Closed on
Oct 8, 2004
Sold by
Genereux John F
Bought by
Avylla Donna and Avylla Thomas F
Create a Home Valuation Report for This Property
The Home Valuation Report is an in-depth analysis detailing your home's value as well as a comparison with similar homes in the area
Home Values in the Area
Average Home Value in this Area
Purchase History
| Date | Buyer | Sale Price | Title Company |
|---|---|---|---|
| Avylla Ft | -- | -- | |
| Avylla Donna | $142,900 | -- |
Source: Public Records
Mortgage History
| Date | Status | Borrower | Loan Amount |
|---|---|---|---|
| Previous Owner | Avylla Donna | $169,000 | |
| Previous Owner | Avylla Donna | $200,000 | |
| Previous Owner | Avylla Donna | $313,180 |
Source: Public Records
Tax History
| Year | Tax Paid | Tax Assessment Tax Assessment Total Assessment is a certain percentage of the fair market value that is determined by local assessors to be the total taxable value of land and additions on the property. | Land | Improvement |
|---|---|---|---|---|
| 2025 | $73 | $677,200 | $172,000 | $505,200 |
| 2024 | $7,119 | $623,900 | $163,000 | $460,900 |
| 2023 | $6,936 | $578,000 | $147,900 | $430,100 |
| 2022 | $6,210 | $468,000 | $138,900 | $329,100 |
| 2021 | $5,946 | $429,900 | $138,900 | $291,000 |
| 2020 | $5,867 | $420,900 | $129,900 | $291,000 |
| 2019 | $5,679 | $400,500 | $123,900 | $276,600 |
| 2018 | $5,465 | $379,000 | $123,900 | $255,100 |
| 2017 | $5,284 | $365,900 | $123,900 | $242,000 |
| 2016 | $5,171 | $355,900 | $123,900 | $232,000 |
| 2015 | $4,887 | $342,200 | $123,900 | $218,300 |
Source: Public Records
Map
Nearby Homes
- 329 Middle Rd
- 134 Nyes Ln
- 7 Hamlin St
- 23 Coury Dr
- 1015 Forbes St
- ES Acushnet Ave
- 40 Foley Dr
- 363 Main St
- 25 Pershing Ave
- 489 Main St
- 2800 Acushnet Ave
- 23 Oliveira Ave
- 1044 Phillips Rd Unit 25
- 1044 Phillips Rd Unit 20
- 27 Meadow Ln
- 1044 Victoria St Unit B-29
- 0 Church Dutton & Chaffee Unit 73371719
- 1027 Kenmore St
- 1056 Victoria St Unit A-13
- 279 Adelaide St
Your Personal Tour Guide
Ask me questions while you tour the home.