Estimated Value: $171,003 - $199,000
--
Bed
2
Baths
1,824
Sq Ft
$100/Sq Ft
Est. Value
About This Home
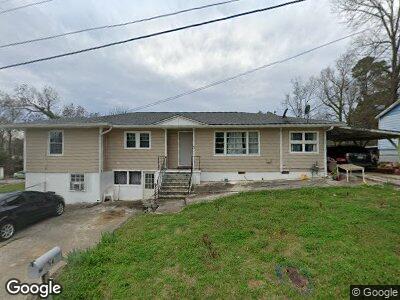
This home is located at 14 Whitehead St SW, Rome, GA 30165 and is currently estimated at $181,751, approximately $99 per square foot. 14 Whitehead St SW is a home located in Floyd County with nearby schools including Rome High School and St. Mary School.
Ownership History
Date
Name
Owned For
Owner Type
Purchase Details
Closed on
Aug 16, 2000
Sold by
Bush Christine Carter
Bought by
Alvarado Jorge
Current Estimated Value
Purchase Details
Closed on
Aug 11, 2000
Bought by
P and R
Purchase Details
Closed on
May 23, 1995
Sold by
Carter Ruby Johnson
Bought by
Bush Christine Carter
Purchase Details
Closed on
Sep 8, 1992
Bought by
P and R
Purchase Details
Closed on
Nov 14, 1990
Sold by
Carter R A
Bought by
Carter Ruby Johnson
Purchase Details
Closed on
Sep 12, 1981
Sold by
Carter Ruby J
Bought by
Carter R A
Purchase Details
Closed on
Jul 29, 1980
Sold by
Carter R A
Bought by
Carter Ruby J
Purchase Details
Closed on
Nov 8, 1968
Sold by
Langley Langley J and Langley Fannie L
Bought by
Carter R A
Purchase Details
Closed on
Feb 28, 1968
Sold by
Carter R A
Bought by
Langley Langley J and Langley Fannie L
Purchase Details
Closed on
Jan 1, 1901
Bought by
Carter R A
Create a Home Valuation Report for This Property
The Home Valuation Report is an in-depth analysis detailing your home's value as well as a comparison with similar homes in the area
Home Values in the Area
Average Home Value in this Area
Purchase History
| Date | Buyer | Sale Price | Title Company |
|---|---|---|---|
| Alvarado Jorge | $69,900 | -- | |
| P | -- | -- | |
| Bush Christine Carter | -- | -- | |
| P | -- | -- | |
| Carter Ruby Johnson | -- | -- | |
| Carter R A | -- | -- | |
| Carter Ruby J | -- | -- | |
| Carter R A | -- | -- | |
| Langley Langley J | -- | -- | |
| Carter R A | -- | -- |
Source: Public Records
Mortgage History
| Date | Status | Borrower | Loan Amount |
|---|---|---|---|
| Open | Alvarado Jorge | $25,000 |
Source: Public Records
Tax History Compared to Growth
Tax History
| Year | Tax Paid | Tax Assessment Tax Assessment Total Assessment is a certain percentage of the fair market value that is determined by local assessors to be the total taxable value of land and additions on the property. | Land | Improvement |
|---|---|---|---|---|
| 2024 | $1,606 | $65,293 | $10,893 | $54,400 |
| 2023 | $1,542 | $61,688 | $9,682 | $52,006 |
| 2022 | $1,398 | $50,419 | $8,069 | $42,350 |
| 2021 | $1,335 | $45,605 | $8,069 | $37,536 |
| 2020 | $1,316 | $44,006 | $6,052 | $37,954 |
| 2019 | $1,261 | $41,421 | $6,052 | $35,369 |
| 2018 | $1,215 | $38,806 | $6,052 | $32,754 |
| 2017 | $1,188 | $37,249 | $6,052 | $31,197 |
| 2016 | $1,170 | $36,053 | $6,040 | $30,013 |
| 2015 | $1,113 | $36,053 | $6,040 | $30,013 |
| 2014 | $1,113 | $36,053 | $6,040 | $30,013 |
Source: Public Records
Map
Nearby Homes
- 103 Wooten Dr SW
- 10 Wingfield St SW
- 20 Burnett Ferry Rd SW
- 104 Dellwood Dr NW
- 10 Leon St SW
- 0 Cedartown Rd Unit 10479932
- 0 Lexington Ln Unit 7312028
- 0 Lexington Ln Unit 10133164
- 3 Pebble Bend Ct
- 7 Texas Ave NW
- 107 Kirton St NW
- 43 Westwood Cir SW
- 101 Garrard Ave NW
- 2 Castlewood Dr SW
- 122 Payne Rd SW
- 438 Wilkerson Rd SW
- 123 Nanellen Rd SW
- 23 Westwood Cir SW
- 7 Hawk Spring Dr SW
- 14 Whitehead St SW
- 34 Whitehead St
- 100 Pineway Dr SW
- 0 Pineway Dr
- 12 Whitehead St SW
- 0 Whitehead St Unit 3123403
- 0 Whitehead St Unit 6935298
- 0 Whitehead St Unit TRACT 33, 34, 35
- 00 Whitehead St
- 0 Whitehead St Unit 6824870
- 0 Whitehead St Unit Tract 33 8772663
- 00 Whitehead St Unit Tract 34-35
- 0 Whitehead St Unit Tract 34-35 8772678
- 0 Whitehead St Unit 6711701
- 0 Whitehead St Unit 7037078
- 0 Whitehead St Unit 7077094
- 0 Whitehead St Unit 7142380
- 0 Whitehead St Unit 8165472
- 0 Whitehead St Unit Tract 34-35 8638067
- 100 Whitehead St SW