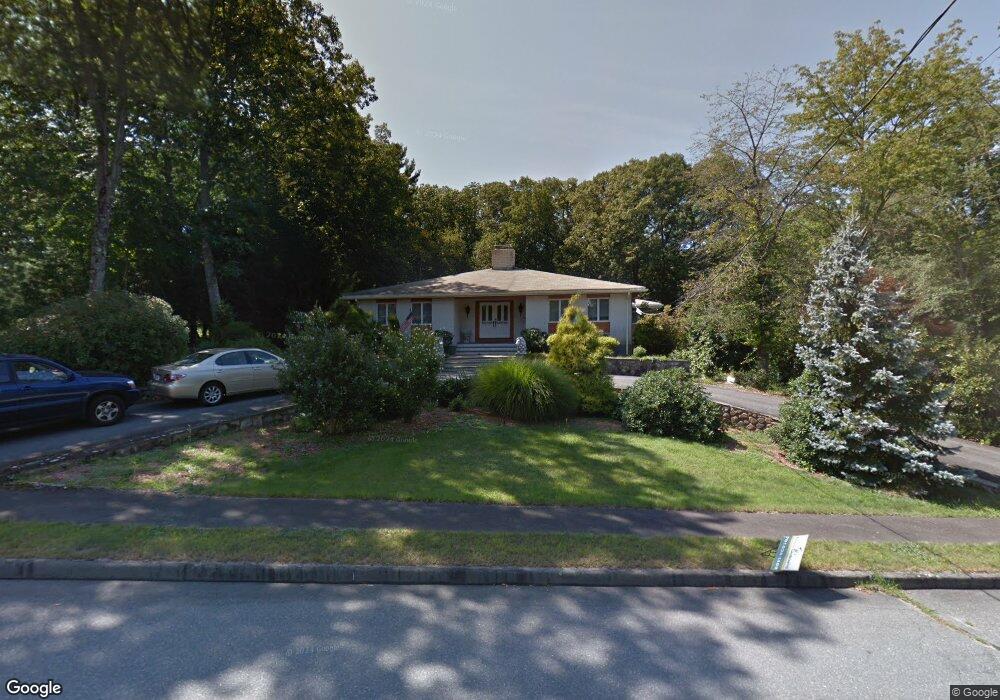
14 Willis Ln Lynnfield, MA 01940
Estimated Value: $1,337,000 - $1,659,000
4
Beds
3
Baths
2,766
Sq Ft
$532/Sq Ft
Est. Value
About This Home
This home is located at 14 Willis Ln, Lynnfield, MA 01940 and is currently estimated at $1,472,252, approximately $532 per square foot. 14 Willis Ln is a home located in Essex County with nearby schools including Lynnfield Middle School, Lynnfield High School, and N Reading Knowledge Beginnings.
Ownership History
Date
Name
Owned For
Owner Type
Purchase Details
Closed on
May 28, 1999
Sold by
Big Steve T and Lessa Stephen Paul
Bought by
Benitez Efrain and Benitez Caterina
Current Estimated Value
Purchase Details
Closed on
Jul 14, 1995
Sold by
Hayes Joseph M and Hayes Lorraine
Bought by
Lessa Stephen P
Create a Home Valuation Report for This Property
The Home Valuation Report is an in-depth analysis detailing your home's value as well as a comparison with similar homes in the area
Home Values in the Area
Average Home Value in this Area
Purchase History
| Date | Buyer | Sale Price | Title Company |
|---|---|---|---|
| Benitez Efrain | $490,000 | -- | |
| Lessa Stephen P | $440,000 | -- |
Source: Public Records
Mortgage History
| Date | Status | Borrower | Loan Amount |
|---|---|---|---|
| Open | Lessa Stephen P | $465,000 | |
| Closed | Lessa Stephen P | $410,000 | |
| Closed | Lessa Stephen P | $400,000 |
Source: Public Records
Tax History
| Year | Tax Paid | Tax Assessment Tax Assessment Total Assessment is a certain percentage of the fair market value that is determined by local assessors to be the total taxable value of land and additions on the property. | Land | Improvement |
|---|---|---|---|---|
| 2025 | $13,299 | $1,259,400 | $804,300 | $455,100 |
| 2024 | $12,407 | $1,180,500 | $751,700 | $428,800 |
| 2023 | $12,549 | $1,110,500 | $712,900 | $397,600 |
| 2022 | $12,554 | $1,047,000 | $703,200 | $343,800 |
| 2021 | $11,529 | $868,800 | $533,500 | $335,300 |
| 2020 | $11,445 | $822,200 | $485,000 | $337,200 |
| 2019 | $11,437 | $822,200 | $485,000 | $337,200 |
| 2018 | $11,081 | $805,300 | $485,000 | $320,300 |
| 2017 | $10,996 | $798,000 | $477,700 | $320,300 |
| 2016 | $10,228 | $705,400 | $400,200 | $305,200 |
| 2015 | $10,017 | $691,300 | $399,700 | $291,600 |
Source: Public Records
Map
Nearby Homes
- 15 Park St Unit A
- 15 Park St Unit B
- 15 Park St
- 4 Hickory Ln
- 8 Cranberry Meadow Way
- 53 Park St
- 415 Lowell St
- 16 Anglewood Ln
- 17 Marshall St
- 25 Apple Hill Ln
- 15 Fairway Ln Unit 55
- 15 Fairway Ln
- 10 Fairway Ln
- 19 Fairway Ln Unit 53
- 1466 Main St
- 1 Stableford Ct Unit 13
- 5 Stableford Ct Unit 11
- 7 Stableford Ct Unit 10
- 9 Stableford Ct Unit 9
- 114 Haverhill St
Your Personal Tour Guide
Ask me questions while you tour the home.