Estimated Value: $276,000 - $414,000
3
Beds
2
Baths
1,334
Sq Ft
$275/Sq Ft
Est. Value
About This Home
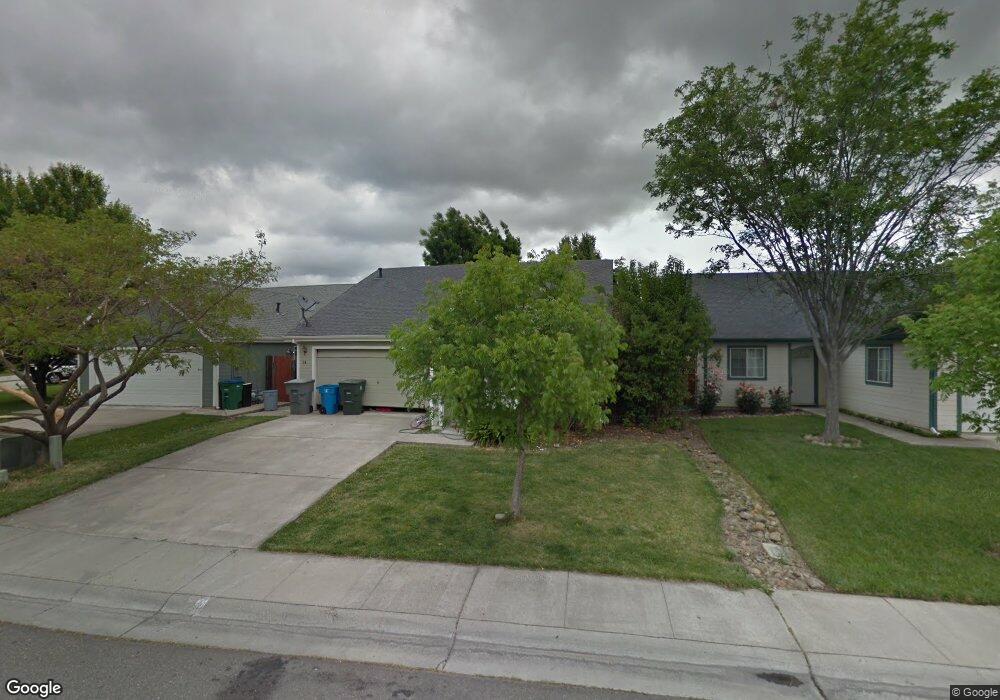
This home is located at 14 Wysong Ct, Chico, CA 95928 and is currently estimated at $366,515, approximately $274 per square foot. 14 Wysong Ct is a home located in Butte County with nearby schools including Little Chico Creek Elementary School, Harry M. Marsh Junior High School, and Chico High School.
Ownership History
Date
Name
Owned For
Owner Type
Purchase Details
Closed on
Mar 20, 2013
Sold by
Vierra Mark A and Vierra Mark
Bought by
Vierra Mark A and Vierra Weena M
Current Estimated Value
Home Financials for this Owner
Home Financials are based on the most recent Mortgage that was taken out on this home.
Original Mortgage
$121,000
Outstanding Balance
$24,799
Interest Rate
3.49%
Mortgage Type
New Conventional
Estimated Equity
$341,716
Purchase Details
Closed on
Sep 30, 2002
Sold by
Bruxvoort Russell W and Bruxvoort Kerstin A
Bought by
Vierra Mark
Home Financials for this Owner
Home Financials are based on the most recent Mortgage that was taken out on this home.
Original Mortgage
$135,000
Interest Rate
6.22%
Mortgage Type
Balloon
Purchase Details
Closed on
Jul 9, 1998
Sold by
Pepperdine Tyron Alan and Pepperdine Rebecca S
Bought by
Bruxvoort Russell W and Bruxvoort Kerstin A
Home Financials for this Owner
Home Financials are based on the most recent Mortgage that was taken out on this home.
Original Mortgage
$101,250
Interest Rate
7.03%
Create a Home Valuation Report for This Property
The Home Valuation Report is an in-depth analysis detailing your home's value as well as a comparison with similar homes in the area
Purchase History
| Date | Buyer | Sale Price | Title Company |
|---|---|---|---|
| Vierra Mark A | -- | Multiple | |
| Vierra Mark | $180,000 | Bidwell Title & Escrow Co | |
| Bruxvoort Russell W | $112,500 | Fidelity National Title Co |
Source: Public Records
Mortgage History
| Date | Status | Borrower | Loan Amount |
|---|---|---|---|
| Open | Vierra Mark A | $121,000 | |
| Closed | Vierra Mark | $135,000 | |
| Previous Owner | Bruxvoort Russell W | $101,250 |
Source: Public Records
Tax History
| Year | Tax Paid | Tax Assessment Tax Assessment Total Assessment is a certain percentage of the fair market value that is determined by local assessors to be the total taxable value of land and additions on the property. | Land | Improvement |
|---|---|---|---|---|
| 2025 | $2,853 | $260,678 | $89,784 | $170,894 |
| 2024 | $2,853 | $255,568 | $88,024 | $167,544 |
| 2023 | $2,823 | $250,558 | $86,299 | $164,259 |
| 2022 | $2,782 | $245,646 | $84,607 | $161,039 |
| 2021 | $2,724 | $240,831 | $82,949 | $157,882 |
| 2020 | $2,722 | $238,363 | $82,099 | $156,264 |
| 2019 | $2,674 | $233,690 | $80,490 | $153,200 |
| 2018 | $2,623 | $229,109 | $78,912 | $150,197 |
| 2017 | $2,572 | $224,617 | $77,365 | $147,252 |
| 2016 | $2,350 | $220,214 | $75,849 | $144,365 |
| 2015 | $2,349 | $216,907 | $74,710 | $142,197 |
| 2014 | $2,295 | $212,659 | $73,247 | $139,412 |
Source: Public Records
Map
Nearby Homes
- 1 Parkhurst St
- 2251 Notre Dame Blvd
- 12 Wrangler Ct
- 2375 Notre Dame Blvd Unit 9
- 2375 Notre Dame Blvd Unit 1
- 2050 Springfield Dr Unit 101
- 2050 Springfield Dr Unit 212
- 1802 Notre Dame Blvd
- 2099 Hartford Dr Unit 6
- 2055 Amanda Way Unit 26
- 123 Raley Blvd
- 1981 Bending Oak Way
- 2215 Laurel St
- 370 Yarrow Dr
- 1991 Humboldt Rd
- 2294 Mulberry St
- 467 E 22nd St
- 3731 Morrow Ln
- 974 Wisconsin St
- 1988 Poppy View Terrace
Your Personal Tour Guide
Ask me questions while you tour the home.