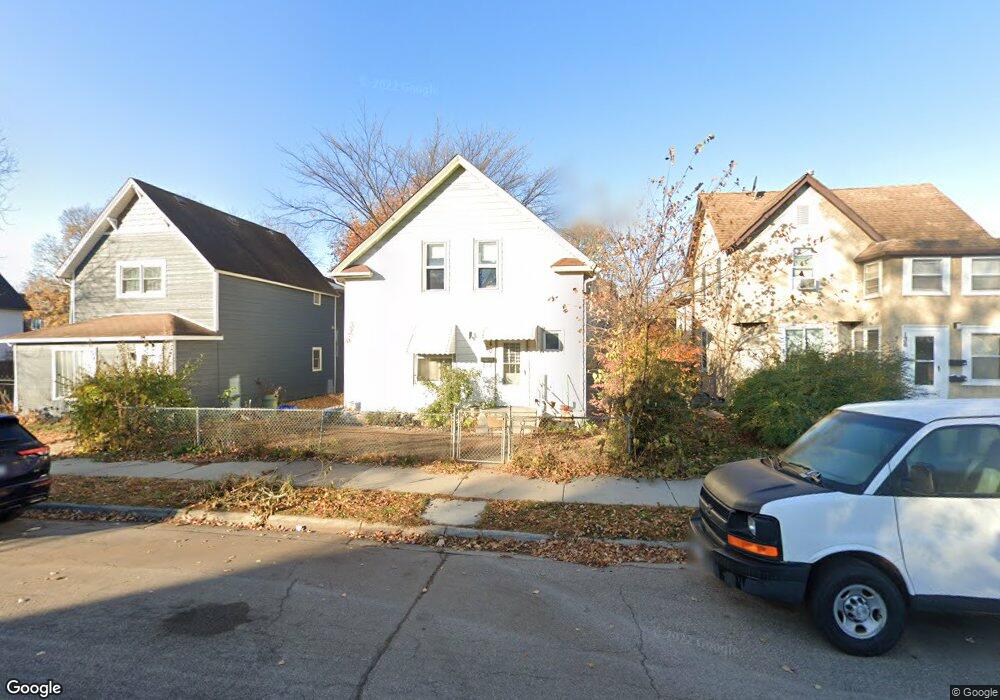
140 2nd Ave S South Saint Paul, MN 55075
Estimated Value: $230,000 - $289,000
4
Beds
2
Baths
1,493
Sq Ft
$181/Sq Ft
Est. Value
About This Home
This home is located at 140 2nd Ave S, South Saint Paul, MN 55075 and is currently estimated at $270,708, approximately $181 per square foot. 140 2nd Ave S is a home located in Dakota County with nearby schools including Kaposia Education Center Elementary, South St. Paul Secondary, and Discovery Charter School.
Ownership History
Date
Name
Owned For
Owner Type
Purchase Details
Closed on
Aug 13, 2021
Sold by
Tindell Katherine Marie and Tindell Ravme Charles
Bought by
Bauer Brian and Bauer Britta
Current Estimated Value
Home Financials for this Owner
Home Financials are based on the most recent Mortgage that was taken out on this home.
Original Mortgage
$238,944
Outstanding Balance
$217,274
Interest Rate
2.9%
Mortgage Type
New Conventional
Estimated Equity
$53,434
Purchase Details
Closed on
Jan 29, 2020
Sold by
Tindell Cheryl A and Estate Of Laurel A Tindell
Bought by
Tindell Rayme Charles and Tindell Katherine Marie
Purchase Details
Closed on
Oct 3, 2012
Sold by
Tindell Laurel Ann
Bought by
Tindell Rayme Charles and Tindell Katherine Marie
Purchase Details
Closed on
Sep 25, 2012
Sold by
Ohmann Arlene R and Ohmann Darven W
Bought by
Tindell Laurel A
Create a Home Valuation Report for This Property
The Home Valuation Report is an in-depth analysis detailing your home's value as well as a comparison with similar homes in the area
Home Values in the Area
Average Home Value in this Area
Purchase History
| Date | Buyer | Sale Price | Title Company |
|---|---|---|---|
| Bauer Brian | $246,478 | Titlesmart Inc | |
| Tindell Rayme Charles | $47,000 | None Available | |
| Tindell Rayme Charles | -- | None Available | |
| Tindell Laurel A | $47,000 | Pcu Title | |
| Bauer Brian Brian | $246,500 | -- |
Source: Public Records
Mortgage History
| Date | Status | Borrower | Loan Amount |
|---|---|---|---|
| Open | Bauer Brian | $238,944 | |
| Closed | Bauer Brian Brian | $238,917 |
Source: Public Records
Tax History Compared to Growth
Tax History
| Year | Tax Paid | Tax Assessment Tax Assessment Total Assessment is a certain percentage of the fair market value that is determined by local assessors to be the total taxable value of land and additions on the property. | Land | Improvement |
|---|---|---|---|---|
| 2024 | $3,512 | $248,900 | $47,000 | $201,900 |
| 2023 | $3,512 | $256,700 | $47,300 | $209,400 |
| 2022 | $2,316 | $251,200 | $47,300 | $203,900 |
| 2021 | $1,990 | $175,700 | $40,800 | $134,900 |
| 2020 | $1,980 | $159,800 | $38,900 | $120,900 |
| 2019 | $1,991 | $162,400 | $37,000 | $125,400 |
| 2018 | $1,674 | $138,800 | $33,700 | $105,100 |
| 2017 | $1,847 | $132,000 | $32,100 | $99,900 |
| 2016 | $1,703 | $114,000 | $29,200 | $84,800 |
| 2015 | $1,219 | $74,158 | $20,172 | $53,986 |
| 2014 | -- | $80,044 | $20,681 | $59,363 |
| 2013 | -- | $64,893 | $16,898 | $47,995 |
Source: Public Records
Map
Nearby Homes
- 336 2nd Ave S
- 100 4th Ave N Unit 112
- 329 4th Ave S
- 105 5th Ave S
- 348 4th Ave S
- 221 Grand Ave W Unit 104
- 454 1st Ave S
- 117 8th Ave S
- 438 6th Ave S
- 409 8th Ave S
- 533 1st Ave S
- 144 10th Ave S
- 454 8th Ave S
- 519 8th Ave S
- 119 10th Ave N
- 236 11th Ave S
- 116 11th Ave S
- 101 11th Ave N
- 526 9th Ave S
- 212 11th Ave N