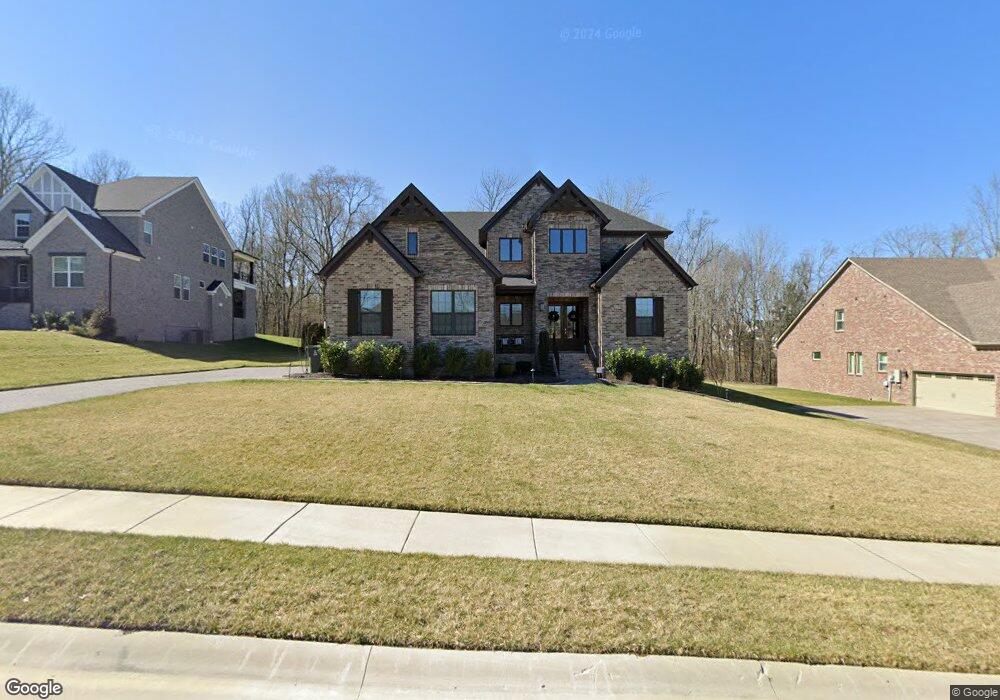
140 Asher Downs Cir Nolensville, TN 37135
Estimated Value: $1,389,187 - $1,486,000
--
Bed
5
Baths
4,031
Sq Ft
$360/Sq Ft
Est. Value
About This Home
This home is located at 140 Asher Downs Cir, Nolensville, TN 37135 and is currently estimated at $1,450,797, approximately $359 per square foot. 140 Asher Downs Cir is a home located in Williamson County with nearby schools including Sunset Elementary School, Sunset Middle School, and Nolensville High School.
Ownership History
Date
Name
Owned For
Owner Type
Purchase Details
Closed on
Sep 23, 2019
Sold by
Boyle Kevin M and Click Lisa L
Bought by
Boyle Kevin M and Boyle Lisa L
Current Estimated Value
Home Financials for this Owner
Home Financials are based on the most recent Mortgage that was taken out on this home.
Original Mortgage
$787,458
Outstanding Balance
$688,241
Interest Rate
3.6%
Mortgage Type
New Conventional
Estimated Equity
$762,556
Purchase Details
Closed on
Aug 23, 2019
Sold by
Drees Premier Homes Inc
Bought by
Boyle Kevin M and Click Lisa L
Home Financials for this Owner
Home Financials are based on the most recent Mortgage that was taken out on this home.
Original Mortgage
$787,458
Outstanding Balance
$688,241
Interest Rate
3.6%
Mortgage Type
New Conventional
Estimated Equity
$762,556
Purchase Details
Closed on
Jun 14, 2018
Sold by
Gilchrist Development Co Llc
Bought by
Drees Premier Homes Inc
Create a Home Valuation Report for This Property
The Home Valuation Report is an in-depth analysis detailing your home's value as well as a comparison with similar homes in the area
Home Values in the Area
Average Home Value in this Area
Purchase History
| Date | Buyer | Sale Price | Title Company |
|---|---|---|---|
| Boyle Kevin M | -- | Chapman & Rosenthal Ttl Inc | |
| Boyle Kevin M | $874,953 | Chapman & Rosenthal Ttl Inc | |
| Drees Premier Homes Inc | $1,650,000 | None Available |
Source: Public Records
Mortgage History
| Date | Status | Borrower | Loan Amount |
|---|---|---|---|
| Open | Boyle Kevin M | $787,458 |
Source: Public Records
Tax History Compared to Growth
Tax History
| Year | Tax Paid | Tax Assessment Tax Assessment Total Assessment is a certain percentage of the fair market value that is determined by local assessors to be the total taxable value of land and additions on the property. | Land | Improvement |
|---|---|---|---|---|
| 2025 | $4,469 | $315,050 | $75,000 | $240,050 |
| 2024 | $4,469 | $205,950 | $45,000 | $160,950 |
| 2023 | $4,469 | $205,950 | $45,000 | $160,950 |
| 2022 | $4,469 | $205,950 | $45,000 | $160,950 |
| 2021 | $4,469 | $205,950 | $45,000 | $160,950 |
| 2020 | $4,595 | $183,050 | $35,000 | $148,050 |
| 2019 | $830 | $183,050 | $35,000 | $148,050 |
| 2018 | $805 | $35,000 | $35,000 | $0 |
Source: Public Records
Map
Nearby Homes
- 1529 Hyde Ln
- 2025 Vail Trace
- 2020 Vail Trace
- 9910 Elland Rd
- 9912 Elland Rd
- 9919 Elland Rd
- 2713 Bering Ct
- 9901 Elland Rd
- 9917 Elland Rd
- 9906 Elland Rd
- 1753 White Hart Ln
- Devonshire II Plan at Telluride - Manor
- Glen Abbey III Plan at Telluride - Manor
- Southhampton Plan at Telluride - Manor
- Westchester II Plan at Telluride - Manor
- St. Andrews III Plan at Telluride - Manor
- Nottingham Plan at Telluride - Manor
- 9905 Elland Rd
- 2009 Vail Trace
- 9909 Elland Rd
- 140 Asher Downs Cir
- 144 Asher Downs Cir
- 136 Asher Downs Cir
- 144 Asher Downs Cir Unit 10
- 144 Asher Downs Cir
- 136 Asher Downs Cir
- 136 Asher Downs Cir
- 132 Asher Downs Cir
- 132 Asher Downs Cir Unit 7
- 132 Asher Downs Cir
- 1615 Sunset Rd
- 1615 Sunset Road Lot 11
- 1615 Sunset Road Lot 13
- 1615 Sunset Road Lot 12
- 1615 Sunset Rd Unit 12
- 1615 Sunset Rd Unit 13
- 1615 Sunset Rd Unit 11
- 152 Asher Downs Cir
- 139 Asher Downs Cir
- 139 Asher Downs Cir