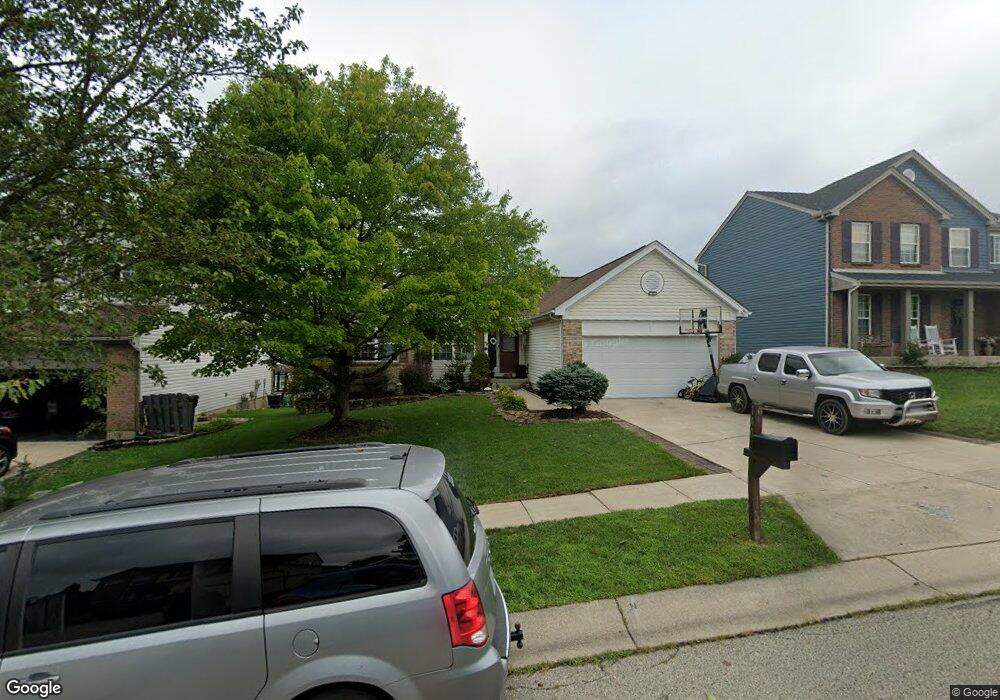
140 Bridle Pass Way Monroe, OH 45050
Estimated Value: $323,239 - $365,000
3
Beds
2
Baths
1,499
Sq Ft
$231/Sq Ft
Est. Value
About This Home
This home is located at 140 Bridle Pass Way, Monroe, OH 45050 and is currently estimated at $346,810, approximately $231 per square foot. 140 Bridle Pass Way is a home located in Butler County with nearby schools including Monroe Primary School, Monroe Elementary School, and Monroe Junior High School.
Ownership History
Date
Name
Owned For
Owner Type
Purchase Details
Closed on
Mar 8, 2007
Sold by
Brenner Al and Brenner Carla R
Bought by
Hughes Andrew M and Arras Abby D
Current Estimated Value
Home Financials for this Owner
Home Financials are based on the most recent Mortgage that was taken out on this home.
Original Mortgage
$140,000
Outstanding Balance
$84,415
Interest Rate
6.19%
Mortgage Type
Purchase Money Mortgage
Estimated Equity
$262,395
Purchase Details
Closed on
Oct 25, 2006
Sold by
Muniz Max and Cole Tracy L
Bought by
Brenner Al
Purchase Details
Closed on
Dec 21, 1999
Sold by
Inverness Group Inc
Bought by
Muniz Max and Davidson Tracy L
Home Financials for this Owner
Home Financials are based on the most recent Mortgage that was taken out on this home.
Original Mortgage
$111,300
Interest Rate
9%
Mortgage Type
Purchase Money Mortgage
Create a Home Valuation Report for This Property
The Home Valuation Report is an in-depth analysis detailing your home's value as well as a comparison with similar homes in the area
Home Values in the Area
Average Home Value in this Area
Purchase History
| Date | Buyer | Sale Price | Title Company |
|---|---|---|---|
| Hughes Andrew M | $475,000 | First Title Inc | |
| Brenner Al | $139,000 | None Available | |
| Muniz Max | $141,220 | -- |
Source: Public Records
Mortgage History
| Date | Status | Borrower | Loan Amount |
|---|---|---|---|
| Open | Hughes Andrew M | $140,000 | |
| Previous Owner | Muniz Max | $111,300 | |
| Closed | Muniz Max | $27,800 |
Source: Public Records
Tax History Compared to Growth
Tax History
| Year | Tax Paid | Tax Assessment Tax Assessment Total Assessment is a certain percentage of the fair market value that is determined by local assessors to be the total taxable value of land and additions on the property. | Land | Improvement |
|---|---|---|---|---|
| 2024 | $4,079 | $90,560 | $11,150 | $79,410 |
| 2023 | $4,052 | $86,260 | $11,150 | $75,110 |
| 2022 | $3,180 | $62,620 | $11,150 | $51,470 |
| 2021 | $3,064 | $62,620 | $11,150 | $51,470 |
| 2020 | $3,174 | $62,620 | $11,150 | $51,470 |
| 2019 | $3,726 | $54,340 | $11,970 | $42,370 |
| 2018 | $2,973 | $54,340 | $11,970 | $42,370 |
| 2017 | $3,036 | $54,340 | $11,970 | $42,370 |
| 2016 | $2,720 | $46,680 | $11,970 | $34,710 |
| 2015 | $2,690 | $46,680 | $11,970 | $34,710 |
| 2014 | $2,464 | $46,680 | $11,970 | $34,710 |
| 2013 | $2,464 | $43,130 | $11,970 | $31,160 |
Source: Public Records
Map
Nearby Homes
- 145 Trotter Ln
- 95 Paddock Ln
- 125 Dobbin Ct
- 505 Austin Smith Dr
- 455 Stillpass Way
- 160 Gorman Ct
- 115 Meeker Ln
- VANDERBURGH Plan at Caravel
- SEBASTIAN Plan at Caravel
- 6935 Gaspar Trail
- ASH LAWN Plan at Caravel
- BENNETT Plan at Caravel
- LYNDHURST Plan at Caravel
- CRESTWOOD Plan at Caravel
- ALDRIDGE Plan at Caravel
- 6893 Gaspar Trail
- BRENNAN Plan at Caravel
- KENDALL Plan at Caravel
- 75 Teil Tree Ct
- 132 Village Ct
- 130 Bridle Pass Way
- 150 Bridle Pass Way
- 120 Bridle Pass Way
- 160 Bridle Pass Way
- 135 Trotter Ln
- 170 Bridle Pass Way
- 125 Trotter Ln
- 180 Bridle Pass Way
- 145 Bridle Pass Way
- 110 Bridle Pass Way
- 155 Bridle Pass Way
- 135 Bridle Pass Way
- 115 Trotter Ln
- 161 Bridle Pass Way
- 125 Bridle Pass Way
- 155 Trotter Ln
- 115 Bridle Pass Way
- 163 Bridle Pass Way
- 171 Bridle Pass Way
- 169 Bridle Pass Way