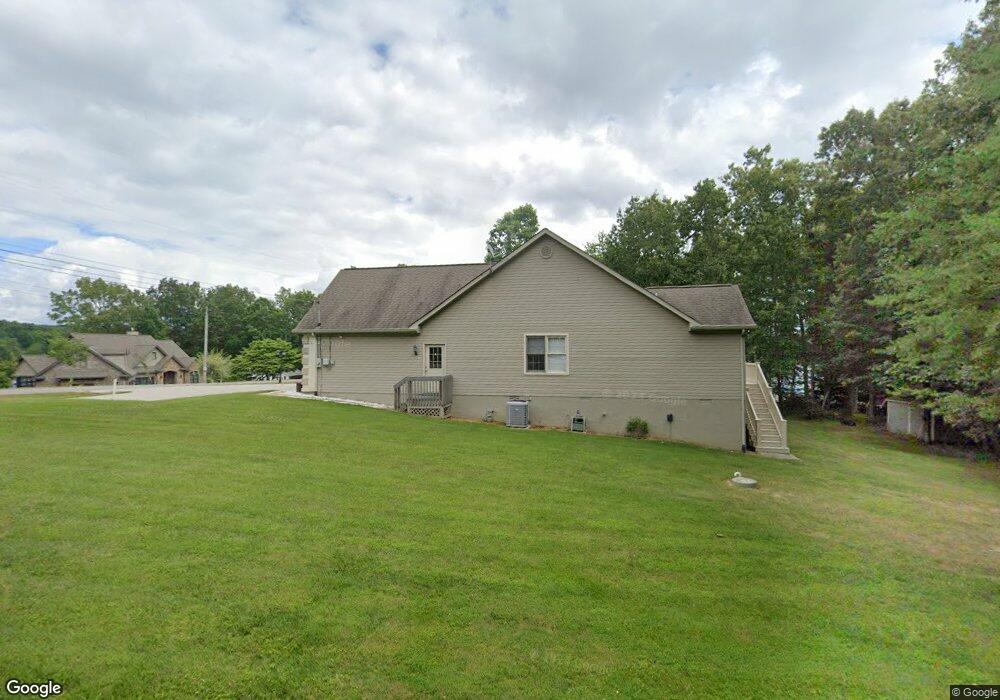
140 Burrough Ln Crossville, TN 38558
Estimated Value: $375,000 - $486,000
--
Bed
2
Baths
2,208
Sq Ft
$198/Sq Ft
Est. Value
About This Home
This home is located at 140 Burrough Ln, Crossville, TN 38558 and is currently estimated at $438,023, approximately $198 per square foot. 140 Burrough Ln is a home located in Cumberland County with nearby schools including Crab Orchard Elementary School and Stone Memorial High School.
Ownership History
Date
Name
Owned For
Owner Type
Purchase Details
Closed on
Feb 9, 2010
Sold by
Dougherty David W
Bought by
Dougherty David W
Current Estimated Value
Home Financials for this Owner
Home Financials are based on the most recent Mortgage that was taken out on this home.
Original Mortgage
$196,000
Interest Rate
5%
Purchase Details
Closed on
Dec 20, 2005
Sold by
Fairfield Resorts Incorpor
Bought by
Dougherty Patricia J
Create a Home Valuation Report for This Property
The Home Valuation Report is an in-depth analysis detailing your home's value as well as a comparison with similar homes in the area
Home Values in the Area
Average Home Value in this Area
Purchase History
| Date | Buyer | Sale Price | Title Company |
|---|---|---|---|
| Dougherty David W | -- | -- | |
| Dougherty Patricia J | $10,000 | -- |
Source: Public Records
Mortgage History
| Date | Status | Borrower | Loan Amount |
|---|---|---|---|
| Closed | Dougherty Patricia J | $196,000 |
Source: Public Records
Tax History Compared to Growth
Tax History
| Year | Tax Paid | Tax Assessment Tax Assessment Total Assessment is a certain percentage of the fair market value that is determined by local assessors to be the total taxable value of land and additions on the property. | Land | Improvement |
|---|---|---|---|---|
| 2025 | -- | $94,700 | $10,500 | $84,200 |
| 2024 | $1,075 | $94,700 | $10,500 | $84,200 |
| 2023 | $1,075 | $94,700 | $0 | $0 |
| 2022 | $1,075 | $94,700 | $10,500 | $84,200 |
| 2021 | $1,075 | $68,700 | $10,500 | $58,200 |
| 2020 | $1,075 | $68,700 | $10,500 | $58,200 |
| 2019 | $1,053 | $68,700 | $10,500 | $58,200 |
| 2018 | $1,053 | $67,300 | $10,500 | $56,800 |
| 2017 | $1,053 | $67,300 | $10,500 | $56,800 |
| 2016 | $1,009 | $66,025 | $10,500 | $55,525 |
| 2015 | $989 | $66,025 | $10,500 | $55,525 |
| 2014 | $989 | $66,025 | $0 | $0 |
Source: Public Records
Map
Nearby Homes
- 107 Brighton Ln
- 110 Delbridge Ln
- 151 Saint George Dr
- 130 Dovenshire Dr
- 207 Saint George Dr
- 219 St George Dr
- 113 Ashdown Ln
- 155 Dovenshire Dr
- 150 Dovenshire Dr
- 229 Saint George Dr
- 230 Saint George Dr
- 233 St George Dr
- 101 Ashdown Ln
- 112 Lakewood Dr
- 107 Ivy Ln
- 104 Juniper Dr
- 111 Rutgers Cir
- 238 Saint George Dr
- 11 Oxford Cir
- 105 Kings Ln
- 138 Burrough Ln
- 136 Burrough Ln
- 118 Bradford Ln
- 117 Bradford Ln
- 141 Burrough Ln
- 139 Burrough Ln
- 134 Burrough Ln
- 115 Bradford Ln
- 137 Burrough Ln
- 100 Delbridge Ln
- 100 Bradford Ln
- 135 Burrough Ln
- 119 Bradford Ln
- 132 Burrough Ln
- 130 & 132 Burrough Ln
- 110 Bradford Ln
- 108 Bradford Ln
- 130 & 132 Burrough Ln
- 104 Delbridge Ln
- 109 Bradford Ln