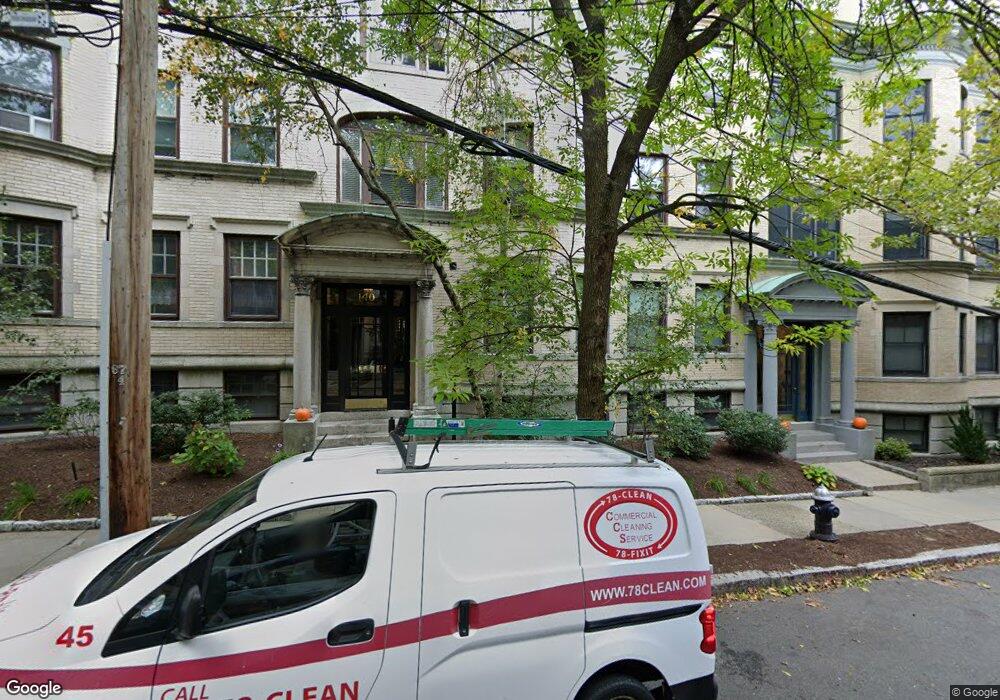
140 Fuller St Unit 2 Brookline, MA 02446
Coolidge Corner NeighborhoodEstimated Value: $625,963 - $701,000
1
Bed
1
Bath
775
Sq Ft
$863/Sq Ft
Est. Value
About This Home
This home is located at 140 Fuller St Unit 2, Brookline, MA 02446 and is currently estimated at $668,991, approximately $863 per square foot. 140 Fuller St Unit 2 is a home located in Norfolk County with nearby schools including Match Charter Public School, New England Hebrew Academy, and Boston University Academy.
Ownership History
Date
Name
Owned For
Owner Type
Purchase Details
Closed on
Apr 28, 2010
Sold by
Gallery Melissa
Bought by
Obrien Kathleen M
Current Estimated Value
Home Financials for this Owner
Home Financials are based on the most recent Mortgage that was taken out on this home.
Original Mortgage
$280,000
Interest Rate
4.99%
Mortgage Type
Purchase Money Mortgage
Purchase Details
Closed on
Jul 31, 2009
Sold by
White Allen L and White Judith K
Bought by
Gallery Melissa
Home Financials for this Owner
Home Financials are based on the most recent Mortgage that was taken out on this home.
Original Mortgage
$332,859
Interest Rate
5.43%
Mortgage Type
Purchase Money Mortgage
Purchase Details
Closed on
Aug 9, 1996
Sold by
Alon Moshe and Alon Donna
Bought by
White Allen L and White Judith K
Purchase Details
Closed on
Apr 4, 1990
Sold by
Shoham Mark
Bought by
Alon Moshe
Home Financials for this Owner
Home Financials are based on the most recent Mortgage that was taken out on this home.
Original Mortgage
$60,000
Interest Rate
10.22%
Mortgage Type
Purchase Money Mortgage
Create a Home Valuation Report for This Property
The Home Valuation Report is an in-depth analysis detailing your home's value as well as a comparison with similar homes in the area
Home Values in the Area
Average Home Value in this Area
Purchase History
| Date | Buyer | Sale Price | Title Company |
|---|---|---|---|
| Obrien Kathleen M | $350,000 | -- | |
| Gallery Melissa | $339,900 | -- | |
| White Allen L | $126,000 | -- | |
| Alon Moshe | $75,000 | -- |
Source: Public Records
Mortgage History
| Date | Status | Borrower | Loan Amount |
|---|---|---|---|
| Open | Alon Moshe | $279,200 | |
| Closed | Obrien Kathleen M | $280,000 | |
| Previous Owner | Alon Moshe | $332,859 | |
| Previous Owner | Alon Moshe | $60,000 |
Source: Public Records
Tax History Compared to Growth
Tax History
| Year | Tax Paid | Tax Assessment Tax Assessment Total Assessment is a certain percentage of the fair market value that is determined by local assessors to be the total taxable value of land and additions on the property. | Land | Improvement |
|---|---|---|---|---|
| 2025 | $5,764 | $584,000 | $0 | $584,000 |
| 2024 | $5,593 | $572,500 | $0 | $572,500 |
| 2023 | $5,596 | $561,300 | $0 | $561,300 |
| 2022 | $5,608 | $550,300 | $0 | $550,300 |
| 2021 | $5,340 | $544,900 | $0 | $544,900 |
| 2020 | $5,098 | $539,500 | $0 | $539,500 |
| 2019 | $4,814 | $513,800 | $0 | $513,800 |
| 2018 | $4,424 | $467,700 | $0 | $467,700 |
| 2017 | $4,278 | $433,000 | $0 | $433,000 |
| 2016 | $4,102 | $393,700 | $0 | $393,700 |
| 2015 | $3,822 | $357,900 | $0 | $357,900 |
| 2014 | $3,784 | $332,200 | $0 | $332,200 |
Source: Public Records
Map
Nearby Homes
- 85 Naples Rd Unit 2
- 116 Thorndike St
- 116 Thorndike St Unit 2
- 116 Thorndike St Unit 1
- 11 Abbottsford Rd
- 373 Harvard St Unit 1
- 52 Babcock St Unit 6
- 233 Freeman St Unit 1
- 28 Verndale St
- 107 Centre St Unit A
- 58 Dwight St Unit 6
- 5 Fiske Terrace
- 45 Dwight St
- 10 Bradford Terrace Unit 5
- 93 Centre St Unit 2
- 51 John St Unit 201
- 99 Crowninshield Rd Unit 99
- 125 Crowninshield Rd Unit 125
- 57 Brighton Ave Unit C
- 57 Brighton Ave Unit B
- 140 Fuller St Unit 1
- 140 Fuller St Unit 5
- 140 Fuller St Unit 4
- 140 Fuller St Unit 3
- 140 Fuller St Unit R
- 140 Fuller St
- 142 Fuller St Unit 1
- 142 Fuller St Unit 3
- 142 Fuller St Unit 2
- 142 Fuller St Unit 4
- 142 Fuller St
- 138 Fuller St Unit B
- 138 Fuller St Unit 5
- 138 Fuller St Unit 4
- 138 Fuller St Unit 3
- 138 Fuller St Unit 2
- 138 Fuller St Unit 1
- 134 Fuller St Unit B
- 134 Fuller St Unit 4
- 134 Fuller St Unit 3