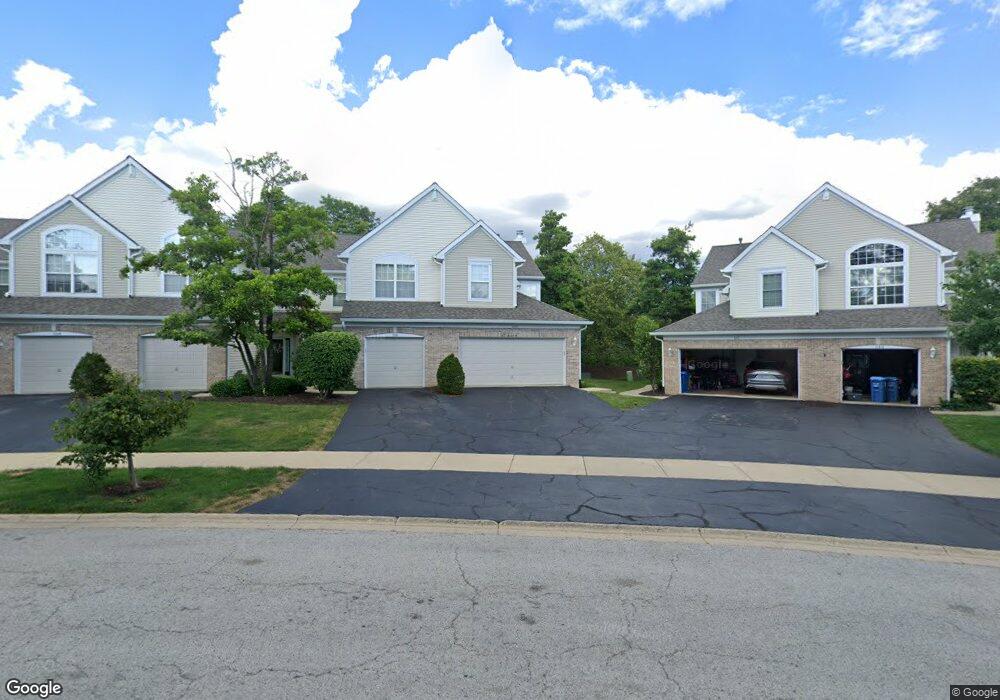
140 Hidden Pond Cir Unit 140 Aurora, IL 60504
Fox Valley NeighborhoodEstimated Value: $285,000 - $299,000
2
Beds
2
Baths
1,507
Sq Ft
$193/Sq Ft
Est. Value
About This Home
This home is located at 140 Hidden Pond Cir Unit 140, Aurora, IL 60504 and is currently estimated at $290,922, approximately $193 per square foot. 140 Hidden Pond Cir Unit 140 is a home located in DuPage County with nearby schools including McCarty Elementary School, Fischer Middle School, and Waubonsie Valley High School.
Ownership History
Date
Name
Owned For
Owner Type
Purchase Details
Closed on
Jun 27, 2003
Sold by
Monticello Lynne M and Wenck Lynne M
Bought by
Castro Michael
Current Estimated Value
Home Financials for this Owner
Home Financials are based on the most recent Mortgage that was taken out on this home.
Original Mortgage
$163,600
Outstanding Balance
$70,131
Interest Rate
5.37%
Mortgage Type
Purchase Money Mortgage
Estimated Equity
$220,791
Purchase Details
Closed on
Sep 8, 2000
Sold by
Hill Dennis A and Hill Susan M
Bought by
Wenck Lynne M
Home Financials for this Owner
Home Financials are based on the most recent Mortgage that was taken out on this home.
Original Mortgage
$142,000
Interest Rate
7.9%
Purchase Details
Closed on
May 21, 1998
Sold by
The Ryland Group Inc
Bought by
Hill Dennis A and Hill Susan M
Home Financials for this Owner
Home Financials are based on the most recent Mortgage that was taken out on this home.
Original Mortgage
$151,050
Interest Rate
7.32%
Create a Home Valuation Report for This Property
The Home Valuation Report is an in-depth analysis detailing your home's value as well as a comparison with similar homes in the area
Home Values in the Area
Average Home Value in this Area
Purchase History
| Date | Buyer | Sale Price | Title Company |
|---|---|---|---|
| Castro Michael | $172,500 | Premier Title | |
| Wenck Lynne M | $152,000 | Stewart Title Company | |
| Hill Dennis A | $159,000 | -- |
Source: Public Records
Mortgage History
| Date | Status | Borrower | Loan Amount |
|---|---|---|---|
| Open | Castro Michael | $163,600 | |
| Previous Owner | Wenck Lynne M | $142,000 | |
| Previous Owner | Hill Dennis A | $151,050 |
Source: Public Records
Tax History Compared to Growth
Tax History
| Year | Tax Paid | Tax Assessment Tax Assessment Total Assessment is a certain percentage of the fair market value that is determined by local assessors to be the total taxable value of land and additions on the property. | Land | Improvement |
|---|---|---|---|---|
| 2024 | $4,571 | $76,122 | $15,636 | $60,486 |
| 2023 | $4,259 | $68,400 | $14,050 | $54,350 |
| 2022 | $4,430 | $63,830 | $13,110 | $50,720 |
| 2021 | $4,712 | $61,550 | $12,640 | $48,910 |
| 2020 | $4,770 | $61,550 | $12,640 | $48,910 |
| 2019 | $4,590 | $58,540 | $12,020 | $46,520 |
| 2018 | $3,923 | $50,420 | $10,350 | $40,070 |
| 2017 | $3,848 | $48,710 | $10,000 | $38,710 |
| 2016 | $3,768 | $46,750 | $9,600 | $37,150 |
| 2015 | $3,713 | $44,380 | $9,110 | $35,270 |
| 2014 | $3,346 | $39,580 | $8,120 | $31,460 |
| 2013 | $3,314 | $39,860 | $8,180 | $31,680 |
Source: Public Records
Map
Nearby Homes
- 199 N Oakhurst Dr Unit 15W
- 72 Heather Glen Dr Unit 72
- 3132 Portland Ct
- 3131 Portland Ct
- 170 Half Moon Cir
- 164 Park Ridge Ln
- 227 Vaughn Rd
- 494 Vaughn Cir
- 369 Vaughn Cir
- 354 Vaughn Cir
- 205 Churchill Ln
- 441 Park Ridge Ln Unit C
- 3140 Medford Ct
- 372 Springlake Ln Unit C
- 2479 Stoughton Cir Unit 351403
- 2481 Stoughton Cir Unit 351402
- 452 Jamestown Ct Unit 506
- 2494 Stoughton Cir Unit 352504
- 300 Churchill Ln
- 482 Betsy Ross Ct
- 2955 Waters Edge Cir Unit 14A
- 2997 Waters Edge Cir Unit 13A
- 3034 Autumn Lake Dr Unit 11B
- 205 Hidden Pond Cir Unit 31
- 178 Hidden Pond Cir Unit 24
- 3000 Waters Edge Cir Unit 6B
- 3144 Autumn Lake Dr
- 3039 Waters Edge Cir Unit F
- 2992 Waters Edge Cir Unit 5A
- 150 Hidden Pond Cir Unit 26A
- 2962 Waters Edge Cir Unit 32962
- 2972 Waters Edge Cir Unit 3E
- 175 Hidden Pond Cir Unit 34
- 2998 Waters Edge Cir Unit 62
- 131 Hidden Pond Cir Unit 131
- 3068 Autumn Lake Dr
- 3003 Waters Edge Cir Unit 13B
- 2999 Waters Edge Cir Unit 13B
- 3004 Waters Edge Cir Unit 6C
- 3035 Autumn Lake Dr