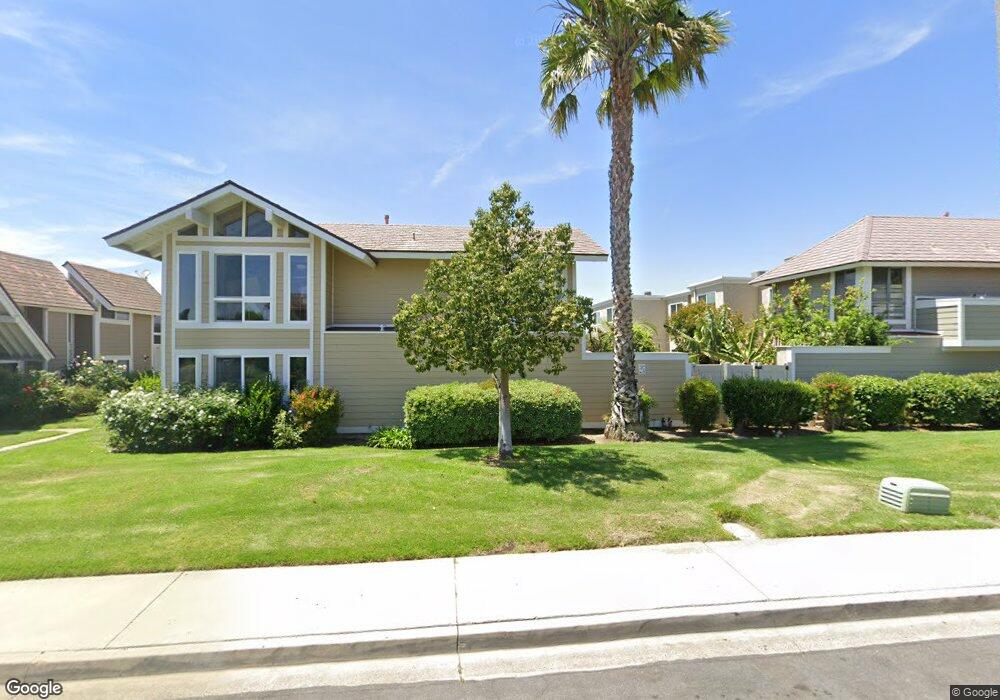
140 Kazan St Unit 1 Irvine, CA 92604
Walnut NeighborhoodEstimated Value: $720,179 - $913,000
2
Beds
2
Baths
1,048
Sq Ft
$785/Sq Ft
Est. Value
About This Home
This home is located at 140 Kazan St Unit 1, Irvine, CA 92604 and is currently estimated at $822,795, approximately $785 per square foot. 140 Kazan St Unit 1 is a home located in Orange County with nearby schools including Greentree Elementary School, Venado Middle School, and Irvine High School.
Ownership History
Date
Name
Owned For
Owner Type
Purchase Details
Closed on
Feb 21, 2001
Sold by
Soussan Mark
Bought by
Moore Edward and Moore Yoshiko
Current Estimated Value
Home Financials for this Owner
Home Financials are based on the most recent Mortgage that was taken out on this home.
Original Mortgage
$188,083
Outstanding Balance
$67,837
Interest Rate
7.06%
Mortgage Type
FHA
Estimated Equity
$754,958
Purchase Details
Closed on
Nov 19, 1996
Sold by
Mason Myrna Trust & Mason Myrna
Bought by
Soussan Mark
Home Financials for this Owner
Home Financials are based on the most recent Mortgage that was taken out on this home.
Original Mortgage
$102,500
Interest Rate
7.67%
Mortgage Type
FHA
Purchase Details
Closed on
Jun 7, 1995
Sold by
Mason Myrna and Mason Karen J
Bought by
Mason Myrna and The Myrna Mason Trust
Create a Home Valuation Report for This Property
The Home Valuation Report is an in-depth analysis detailing your home's value as well as a comparison with similar homes in the area
Home Values in the Area
Average Home Value in this Area
Purchase History
| Date | Buyer | Sale Price | Title Company |
|---|---|---|---|
| Moore Edward | $194,000 | Commonwealth Land Title | |
| Soussan Mark | $121,000 | Orange Coast Title | |
| Mason Myrna | -- | -- |
Source: Public Records
Mortgage History
| Date | Status | Borrower | Loan Amount |
|---|---|---|---|
| Open | Moore Edward | $188,083 | |
| Previous Owner | Soussan Mark | $102,500 |
Source: Public Records
Tax History Compared to Growth
Tax History
| Year | Tax Paid | Tax Assessment Tax Assessment Total Assessment is a certain percentage of the fair market value that is determined by local assessors to be the total taxable value of land and additions on the property. | Land | Improvement |
|---|---|---|---|---|
| 2025 | $3,080 | $292,168 | $210,811 | $81,357 |
| 2024 | $3,080 | $286,440 | $206,678 | $79,762 |
| 2023 | $2,999 | $280,824 | $202,625 | $78,199 |
| 2022 | $2,935 | $275,318 | $198,652 | $76,666 |
| 2021 | $2,864 | $269,920 | $194,757 | $75,163 |
| 2020 | $2,848 | $267,153 | $192,760 | $74,393 |
| 2019 | $2,783 | $261,915 | $188,980 | $72,935 |
| 2018 | $2,731 | $256,780 | $185,275 | $71,505 |
| 2017 | $2,674 | $251,746 | $181,643 | $70,103 |
| 2016 | $2,558 | $246,810 | $178,081 | $68,729 |
| 2015 | $2,466 | $243,103 | $175,406 | $67,697 |
| 2014 | $2,417 | $238,341 | $171,970 | $66,371 |
Source: Public Records
Map
Nearby Homes
- 45 Golden Glen St Unit 75
- 32 Kazan St Unit 18
- 5151 Walnut Ave Unit 34
- 14851 Jeffrey Rd Unit 246
- 14851 Jeffrey Rd Unit 61
- 14851 Jeffrey Rd Unit 25
- 14851 Jeffrey Rd Unit 352
- 14851 Jeffrey Rd Unit 248
- 14851 Jeffrey Rd Unit 350
- 14851 Jeffrey Rd Unit 145
- 14851 Jeffrey Rd Unit 65
- 14851 Jeffrey Rd Unit 17
- 14851 Jeffrey Rd Unit 199
- 14851 Jeffrey Rd Unit 334
- 10 Raleigh
- 14942 Dahlquist Rd
- 14612 Highcrest Cir
- 14871 Pinehaven Rd
- 4862 Gainsport Cir
- 15071 Talley St
- 142 Kazan St
- 134 Kazan St Unit 3
- 134 Kazan St
- 130 Kazan St
- 150 Kazan St Unit 1
- 150 Kazan St
- 154 Kazan St Unit 3
- 14682 Sweetan St
- 122 Kazan St Unit 2
- 120 Kazan St Unit 1
- 14672 Sweetan St
- 14702 Sweetan St
- 141 Kazan St Unit 1
- 141 Kazan St
- 14662 Sweetan St
- 160 Kazan St Unit 1
- 160 Kazan St
- 164 Kazan St Unit 3
- 14712 Sweetan St
- 14652 Sweetan St