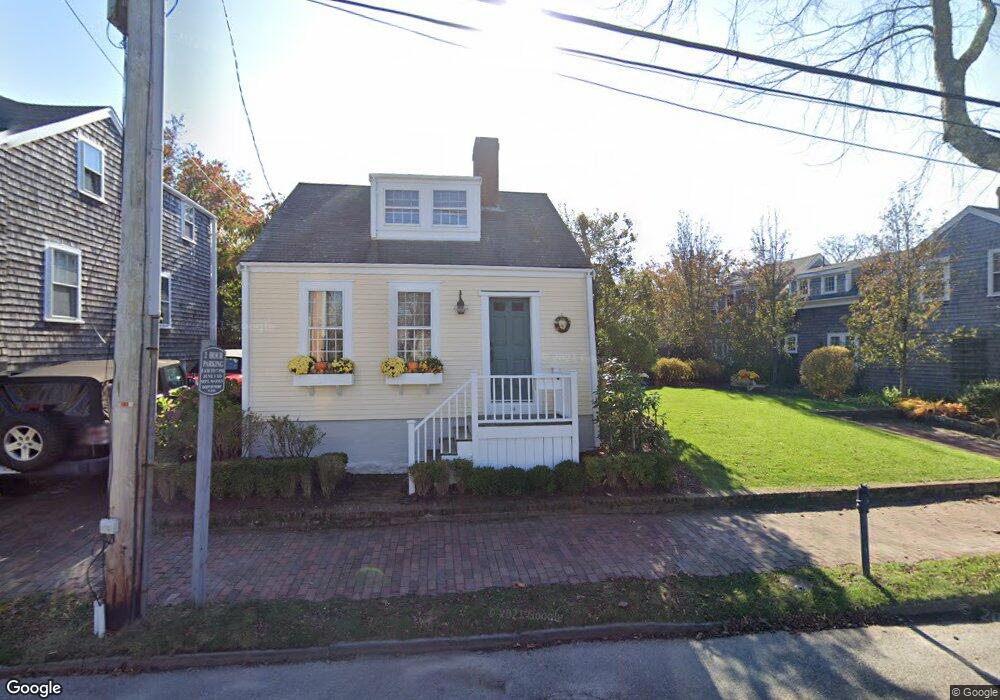
140 Main St Nantucket, MA 02554
Estimated Value: $3,223,000 - $6,533,000
4
Beds
3
Baths
2,404
Sq Ft
$1,914/Sq Ft
Est. Value
About This Home
This home is located at 140 Main St, Nantucket, MA 02554 and is currently estimated at $4,600,914, approximately $1,913 per square foot. 140 Main St is a home located in Nantucket County with nearby schools including Nantucket Elementary School, Cyrus Peirce Middle School, and Nantucket High School.
Ownership History
Date
Name
Owned For
Owner Type
Purchase Details
Closed on
May 28, 1993
Sold by
Clark Thomas J and Clark Noreen A
Bought by
Montalbano Michael A and Montalbano Joyce M
Current Estimated Value
Create a Home Valuation Report for This Property
The Home Valuation Report is an in-depth analysis detailing your home's value as well as a comparison with similar homes in the area
Home Values in the Area
Average Home Value in this Area
Purchase History
| Date | Buyer | Sale Price | Title Company |
|---|---|---|---|
| Montalbano Michael A | $310,000 | -- | |
| Montalbano Michael A | $310,000 | -- |
Source: Public Records
Mortgage History
| Date | Status | Borrower | Loan Amount |
|---|---|---|---|
| Open | Montalbano Michael A | $150,000 | |
| Closed | Montalbano Michael A | $90,000 |
Source: Public Records
Tax History
| Year | Tax Paid | Tax Assessment Tax Assessment Total Assessment is a certain percentage of the fair market value that is determined by local assessors to be the total taxable value of land and additions on the property. | Land | Improvement |
|---|---|---|---|---|
| 2025 | $9,524 | $2,903,800 | $1,536,200 | $1,367,600 |
| 2024 | $8,976 | $2,867,700 | $1,536,200 | $1,331,500 |
| 2023 | $7,897 | $2,460,000 | $1,463,000 | $997,000 |
| 2022 | $7,683 | $2,054,400 | $1,219,800 | $834,600 |
| 2021 | $7,435 | $2,048,300 | $1,123,500 | $924,800 |
| 2020 | $7,564 | $2,192,600 | $1,123,500 | $1,069,100 |
| 2019 | $7,361 | $2,190,900 | $1,121,800 | $1,069,100 |
| 2018 | $6,715 | $1,902,400 | $1,121,800 | $780,600 |
| 2017 | $6,327 | $1,866,300 | $1,121,800 | $744,500 |
| 2016 | $6,163 | $1,834,200 | $1,089,700 | $744,500 |
| 2015 | $6,811 | $1,886,600 | $1,106,000 | $780,600 |
| 2014 | $6,595 | $1,753,900 | $973,300 | $780,600 |
Source: Public Records
Map
Nearby Homes
Your Personal Tour Guide
Ask me questions while you tour the home.