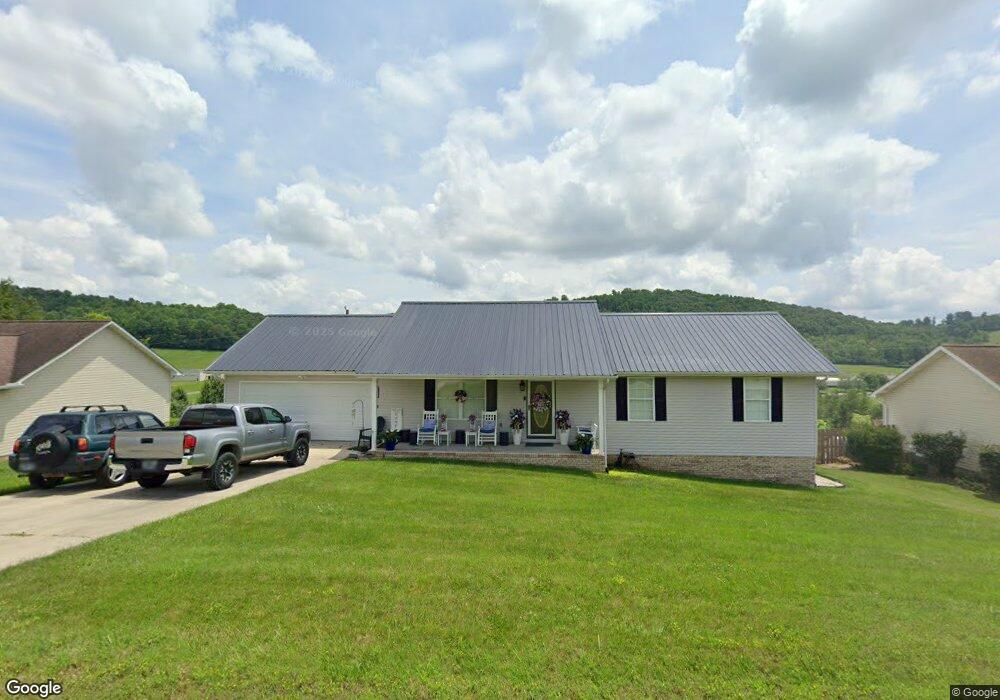
140 Mallory Dr New Tazewell, TN 37825
Estimated Value: $198,172 - $260,000
--
Bed
2
Baths
1,248
Sq Ft
$184/Sq Ft
Est. Value
About This Home
This home is located at 140 Mallory Dr, New Tazewell, TN 37825 and is currently estimated at $230,043, approximately $184 per square foot. 140 Mallory Dr is a home located in Claiborne County with nearby schools including Heriage Christian Academy.
Ownership History
Date
Name
Owned For
Owner Type
Purchase Details
Closed on
Apr 11, 2003
Sold by
Beeler Howard
Bought by
Mccoy Janice
Current Estimated Value
Home Financials for this Owner
Home Financials are based on the most recent Mortgage that was taken out on this home.
Original Mortgage
$86,300
Outstanding Balance
$45,540
Interest Rate
5.6%
Estimated Equity
$184,503
Purchase Details
Closed on
Apr 30, 2002
Sold by
Dean William
Bought by
Beeler Howard
Purchase Details
Closed on
Apr 1, 1998
Sold by
Ball Roger A and Ball James C
Bought by
Dean William
Purchase Details
Closed on
Sep 29, 1997
Bought by
Dean William E
Purchase Details
Closed on
Apr 3, 1989
Bought by
Ball Roger A and Neely James C
Create a Home Valuation Report for This Property
The Home Valuation Report is an in-depth analysis detailing your home's value as well as a comparison with similar homes in the area
Home Values in the Area
Average Home Value in this Area
Purchase History
| Date | Buyer | Sale Price | Title Company |
|---|---|---|---|
| Mccoy Janice | $86,300 | -- | |
| Beeler Howard | $8,000 | -- | |
| Dean William | $11,000 | -- | |
| Dean William E | $11,000 | -- | |
| Ball Roger A | -- | -- |
Source: Public Records
Mortgage History
| Date | Status | Borrower | Loan Amount |
|---|---|---|---|
| Open | Ball Roger A | $86,300 |
Source: Public Records
Tax History Compared to Growth
Tax History
| Year | Tax Paid | Tax Assessment Tax Assessment Total Assessment is a certain percentage of the fair market value that is determined by local assessors to be the total taxable value of land and additions on the property. | Land | Improvement |
|---|---|---|---|---|
| 2024 | $937 | $40,050 | $2,600 | $37,450 |
| 2023 | $937 | $40,050 | $2,600 | $37,450 |
| 2022 | $801 | $40,050 | $2,600 | $37,450 |
| 2021 | $759 | $29,450 | $1,775 | $27,675 |
| 2020 | $759 | $29,450 | $1,775 | $27,675 |
| 2019 | $759 | $29,450 | $1,775 | $27,675 |
| 2018 | $759 | $29,450 | $1,775 | $27,675 |
| 2017 | $759 | $29,450 | $1,775 | $27,675 |
| 2016 | $780 | $30,225 | $1,775 | $28,450 |
| 2015 | $750 | $30,225 | $1,775 | $28,450 |
| 2014 | $750 | $30,237 | $0 | $0 |
Source: Public Records
Map
Nearby Homes