140 McKey Ct Athens, GA 30605
Estimated Value: $284,000 - $308,000
--
Bed
--
Bath
1,562
Sq Ft
$190/Sq Ft
Est. Value
About This Home
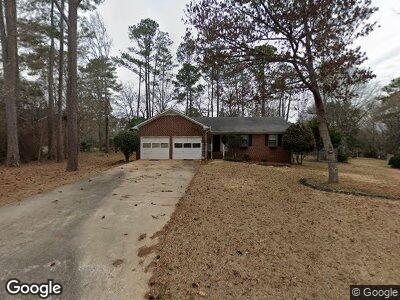
This home is located at 140 McKey Ct, Athens, GA 30605 and is currently estimated at $297,432, approximately $190 per square foot. 140 McKey Ct is a home located in Clarke County with nearby schools including Barnett Shoals Elementary School, Hilsman Middle School, and Cedar Shoals High School.
Ownership History
Date
Name
Owned For
Owner Type
Purchase Details
Closed on
Aug 31, 2022
Sold by
Boenig Markus
Bought by
140 Mckey Llc
Current Estimated Value
Purchase Details
Closed on
Jul 18, 2003
Sold by
Jones Robin L
Bought by
Boenig Markus and Boenig Meghan M
Purchase Details
Closed on
Jun 25, 1999
Sold by
Caughran Joel Allen and Caughran Tashia V
Bought by
Jones Robin L
Purchase Details
Closed on
Nov 13, 1996
Sold by
Caughran Joel Allen
Bought by
Caughran Joel Allen and Caug Tashia V
Purchase Details
Closed on
Jun 23, 1995
Sold by
Shue Jeffrey A and Shue Laura L
Bought by
Caughran Joel Allen
Purchase Details
Closed on
Oct 21, 1994
Sold by
Cameron & Barkley Company
Bought by
Shue Jeffrey A and Shue Laura L
Purchase Details
Closed on
Aug 12, 1994
Sold by
Foster Rickey W and Foster Renee F
Bought by
Cameron & Barkley Company
Create a Home Valuation Report for This Property
The Home Valuation Report is an in-depth analysis detailing your home's value as well as a comparison with similar homes in the area
Home Values in the Area
Average Home Value in this Area
Purchase History
| Date | Buyer | Sale Price | Title Company |
|---|---|---|---|
| 140 Mckey Llc | -- | -- | |
| Boenig Markus | $127,000 | -- | |
| Jones Robin L | $109,400 | -- | |
| Caughran Joel Allen | -- | -- | |
| Caughran Joel Allen | $91,500 | -- | |
| Shue Jeffrey A | $88,900 | -- | |
| Cameron & Barkley Company | $85,800 | -- |
Source: Public Records
Mortgage History
| Date | Status | Borrower | Loan Amount |
|---|---|---|---|
| Previous Owner | Boenig Markus | $98,000 | |
| Previous Owner | Boenig Markus | $95,250 |
Source: Public Records
Tax History Compared to Growth
Tax History
| Year | Tax Paid | Tax Assessment Tax Assessment Total Assessment is a certain percentage of the fair market value that is determined by local assessors to be the total taxable value of land and additions on the property. | Land | Improvement |
|---|---|---|---|---|
| 2024 | $3,201 | $102,434 | $12,000 | $90,434 |
| 2023 | $3,201 | $97,820 | $12,000 | $85,820 |
| 2022 | $2,656 | $83,255 | $10,400 | $72,855 |
| 2021 | $2,247 | $66,674 | $10,400 | $56,274 |
| 2020 | $1,996 | $59,214 | $10,400 | $48,814 |
| 2019 | $1,918 | $56,500 | $10,400 | $46,100 |
| 2018 | $1,849 | $54,448 | $10,400 | $44,048 |
| 2017 | $1,670 | $49,186 | $10,400 | $38,786 |
| 2016 | $1,576 | $46,420 | $10,400 | $36,020 |
| 2015 | $1,611 | $47,394 | $10,400 | $36,994 |
| 2014 | $1,614 | $47,391 | $10,400 | $36,991 |
Source: Public Records
Map
Nearby Homes
- 123 Stonybrook Ct
- 440 Wood Ln
- 266 Wiltshire Dr
- 125 & 127 Laurie Dr
- 159 Oak Meadow Dr
- 175 Greenwood Ln
- 195 Wolfe Ln
- 111 Sapphire Ct
- 3920 Old Lexington Rd
- 175 Williamsburg Ln
- 162 Wakefield Trace
- 154 Diamond Dr
- 235 Ansley Dr
- 150 Wakefield Dr
- 165 Red Fox Run
- 310 Ansley Dr
- 226 Highland Park Dr
- 172 Highland Park Dr
- 166/168/170 Highland Park Dr
- 140 McKey Ct
- 130 McKey Ct
- 150 McKey Ct
- 240 Brookstone Dr
- 230 Brookstone Dr
- 120 McKey Ct
- 250 Brookstone Dr
- 160 McKey Ct
- 135 McKey Ct
- 260 Brookstone Dr
- 0 McKey Ct
- 220 Brookstone Dr
- 280 Brookstone Dr
- 155 McKey Ct
- 170 McKey Ct
- 300 Brookstone Dr
- 340 Brookstone Dr
- 131 Woodberry Dr
- 320 Brookstone Dr
- 235 Brookstone Dr