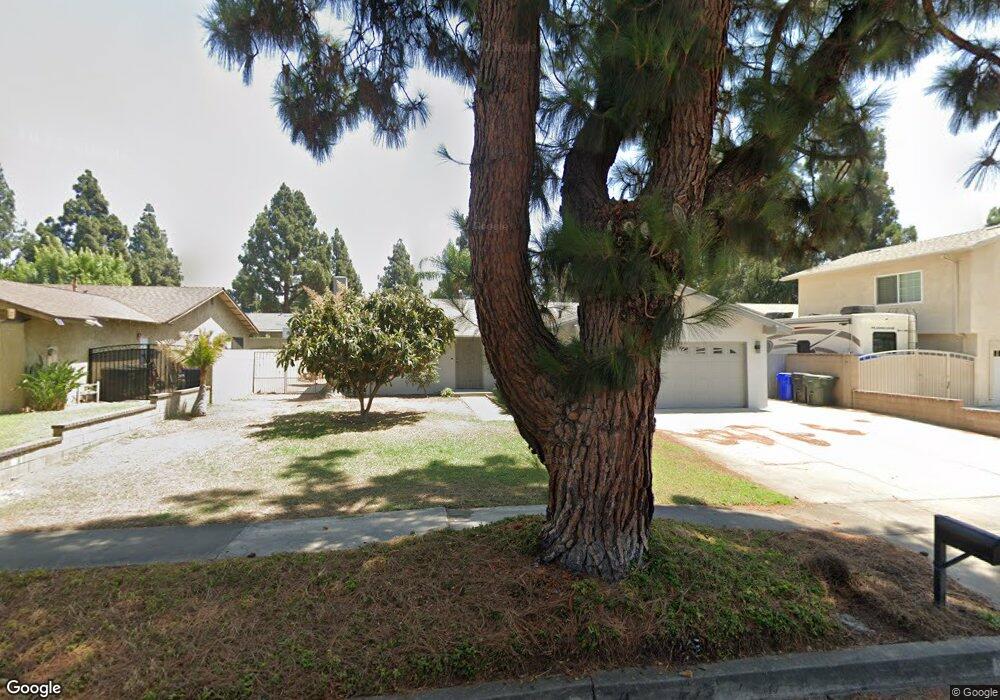
140 N Vallejo Way Upland, CA 91786
Estimated Value: $708,550 - $940,000
4
Beds
2
Baths
1,663
Sq Ft
$469/Sq Ft
Est. Value
About This Home
This home is located at 140 N Vallejo Way, Upland, CA 91786 and is currently estimated at $780,138, approximately $469 per square foot. 140 N Vallejo Way is a home located in San Bernardino County with nearby schools including Baldy View Elementary School, Upland Junior High School, and Upland High School.
Ownership History
Date
Name
Owned For
Owner Type
Purchase Details
Closed on
Aug 28, 2024
Sold by
Chen Andy and Hua San Gia
Bought by
Chen Family Revocable Trust and Chen
Current Estimated Value
Purchase Details
Closed on
Feb 17, 1994
Sold by
Federal Home Loan Mortgage Corporation
Bought by
Chen Andy
Home Financials for this Owner
Home Financials are based on the most recent Mortgage that was taken out on this home.
Original Mortgage
$96,000
Interest Rate
7.21%
Purchase Details
Closed on
Oct 27, 1993
Sold by
Cal Western Reconveyance Corp
Bought by
Federal Home Loan Mortgage Corporation
Purchase Details
Closed on
Aug 13, 1993
Sold by
Beneficial Management Corp Of America
Bought by
Beneficial Mtg Co Of California
Create a Home Valuation Report for This Property
The Home Valuation Report is an in-depth analysis detailing your home's value as well as a comparison with similar homes in the area
Home Values in the Area
Average Home Value in this Area
Purchase History
| Date | Buyer | Sale Price | Title Company |
|---|---|---|---|
| Chen Family Revocable Trust | -- | None Listed On Document | |
| Chen Andy | $128,000 | Northern Counties Title | |
| Federal Home Loan Mortgage Corporation | $130,000 | Stewart Title Co | |
| Beneficial Mtg Co Of California | $18,532 | World Title Company |
Source: Public Records
Mortgage History
| Date | Status | Borrower | Loan Amount |
|---|---|---|---|
| Previous Owner | Chen Andy | $96,000 |
Source: Public Records
Tax History Compared to Growth
Tax History
| Year | Tax Paid | Tax Assessment Tax Assessment Total Assessment is a certain percentage of the fair market value that is determined by local assessors to be the total taxable value of land and additions on the property. | Land | Improvement |
|---|---|---|---|---|
| 2025 | $2,461 | $217,560 | $67,988 | $149,572 |
| 2024 | $2,461 | $213,294 | $66,655 | $146,639 |
| 2023 | $2,422 | $209,112 | $65,348 | $143,764 |
| 2022 | $2,369 | $205,012 | $64,067 | $140,945 |
| 2021 | $2,364 | $200,992 | $62,811 | $138,181 |
| 2020 | $2,300 | $198,931 | $62,167 | $136,764 |
| 2019 | $2,293 | $195,030 | $60,948 | $134,082 |
| 2018 | $2,239 | $191,206 | $59,753 | $131,453 |
| 2017 | $2,175 | $187,456 | $58,581 | $128,875 |
| 2016 | $1,990 | $183,780 | $57,432 | $126,348 |
| 2015 | $1,945 | $181,019 | $56,569 | $124,450 |
| 2014 | $1,895 | $177,473 | $55,461 | $122,012 |
Source: Public Records
Map
Nearby Homes
- 537 W 9th St
- 435 W 9th St Unit A6
- 435 W 9th St Unit F5
- 435 W 9th St Unit B3
- 228 Greentree Rd
- 164 Euclid Place
- 173 W 8th St
- 173 Elizabeth Ln
- 384 W 7th St
- 424 W 7th St
- 595 Juniper Ave
- Plan 3 at Towns on First - Towns On First
- Plan 4 at Towns on First - Towns On First
- 119 N 1st Ave
- 345 S Euclid Ave
- 125 Towns Ave
- 0 Bay St Unit AR25093919
- 681 Birch Ave
- 340 W Caroline Ct
- 855 N Palm Ave
- 156 N Vallejo Way
- 120 N Vallejo Way
- 141 N Ukiah Way
- 157 N Ukiah Way
- 123 N Ukiah Way
- 174 N Vallejo Way
- 141 N Vallejo Way
- 173 N Ukiah Way
- 157 N Vallejo Way
- 123 N Vallejo Way
- 192 N Vallejo Way
- 730 Pearl St
- 710 Pearl St
- 189 N Ukiah Way
- 752 Pearl St
- 105 N Vallejo Way
- 684 Pearl St
- 189 N Vallejo Way
- 140 N Ukiah Way
- 154 N Ukiah Way