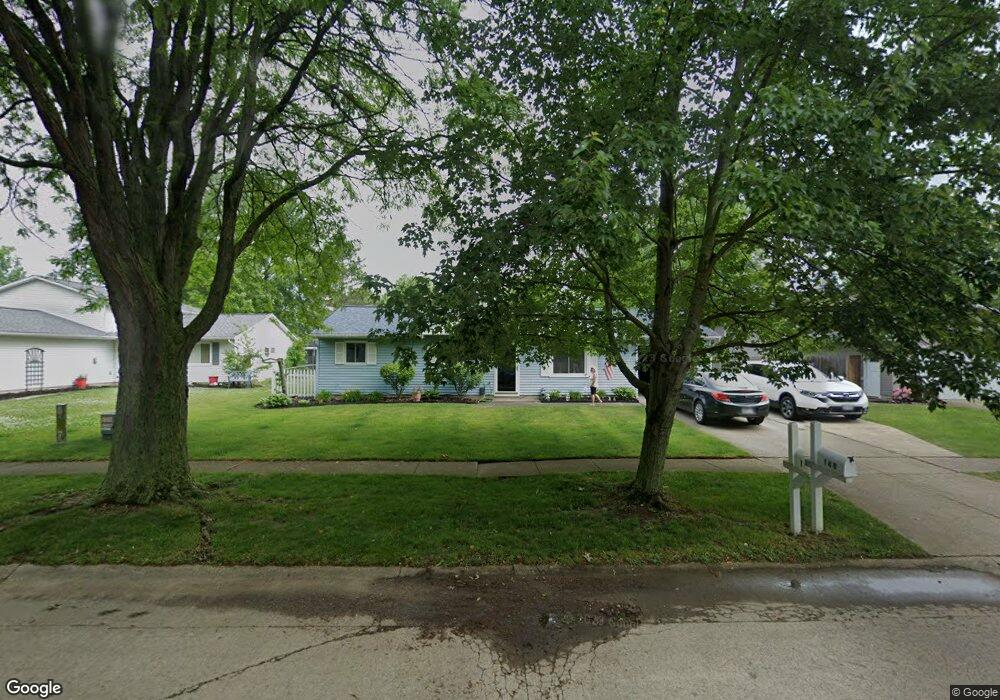
140 Nebraska Ave Elyria, OH 44035
Estimated Value: $158,650 - $210,000
3
Beds
1
Bath
960
Sq Ft
$195/Sq Ft
Est. Value
About This Home
This home is located at 140 Nebraska Ave, Elyria, OH 44035 and is currently estimated at $187,163, approximately $194 per square foot. 140 Nebraska Ave is a home located in Lorain County with nearby schools including Eastern Heights Middle School, Elyria High School, and Constellation Schools: Elyria Community Elementary.
Ownership History
Date
Name
Owned For
Owner Type
Purchase Details
Closed on
Apr 18, 2022
Sold by
Shamrock Building Company Ltd
Bought by
Flanigan Kevin J and Flanigan Gail E
Current Estimated Value
Purchase Details
Closed on
Dec 28, 2007
Sold by
Booth Andrew S and Booth Theresa A
Bought by
Shamrock Building Co Ltd
Purchase Details
Closed on
Sep 11, 2003
Sold by
Bartow John H
Bought by
Booth Andrew S and Booth Theresa A
Home Financials for this Owner
Home Financials are based on the most recent Mortgage that was taken out on this home.
Original Mortgage
$79,600
Interest Rate
5.25%
Mortgage Type
Purchase Money Mortgage
Purchase Details
Closed on
Jan 8, 1998
Sold by
Sefcovic Mark E
Bought by
Bartow John H
Home Financials for this Owner
Home Financials are based on the most recent Mortgage that was taken out on this home.
Original Mortgage
$86,500
Interest Rate
7.26%
Mortgage Type
VA
Create a Home Valuation Report for This Property
The Home Valuation Report is an in-depth analysis detailing your home's value as well as a comparison with similar homes in the area
Home Values in the Area
Average Home Value in this Area
Purchase History
| Date | Buyer | Sale Price | Title Company |
|---|---|---|---|
| Flanigan Kevin J | -- | None Listed On Document | |
| Shamrock Building Co Ltd | -- | Multiple | |
| Booth Andrew S | $99,500 | Midland | |
| Bartow John H | $84,000 | Lorain County Title Co Inc |
Source: Public Records
Mortgage History
| Date | Status | Borrower | Loan Amount |
|---|---|---|---|
| Previous Owner | Booth Andrew S | $79,600 | |
| Previous Owner | Bartow John H | $86,500 |
Source: Public Records
Tax History
| Year | Tax Paid | Tax Assessment Tax Assessment Total Assessment is a certain percentage of the fair market value that is determined by local assessors to be the total taxable value of land and additions on the property. | Land | Improvement |
|---|---|---|---|---|
| 2024 | $1,996 | $41,178 | $12,996 | $28,182 |
| 2023 | $1,929 | $34,542 | $10,014 | $24,528 |
| 2022 | $1,875 | $34,542 | $10,014 | $24,528 |
| 2021 | $1,880 | $34,542 | $10,014 | $24,528 |
| 2020 | $1,754 | $28,670 | $8,310 | $20,360 |
| 2019 | $1,743 | $28,670 | $8,310 | $20,360 |
| 2018 | $1,656 | $28,670 | $8,310 | $20,360 |
| 2017 | $1,565 | $24,620 | $8,410 | $16,210 |
| 2016 | $1,544 | $24,620 | $8,410 | $16,210 |
| 2015 | $1,446 | $24,620 | $8,410 | $16,210 |
| 2014 | $1,401 | $24,140 | $8,250 | $15,890 |
| 2013 | $1,388 | $24,140 | $8,250 | $15,890 |
Source: Public Records
Map
Nearby Homes
- 134 California Ave
- 715 Carol Ln
- 128 Richmond Ct
- 134 Richmond Ct
- 239 Syracuse Ct
- 217 Syracuse Ct
- 475 Carol Ln
- 348 Pemberton Dr
- 38227 Chestnut Ridge Rd
- 459 Auburn St
- 10488 Dewhurst Rd
- 418 Carol Ln
- 124 Oakley Green Dr
- 121 Oakley Green Dr Unit 13
- 346 Lily Ln
- 349 Lily Ln
- 367 Lily Ln
- 106 Stonecrest Trail
- 102 Stonecrest Trail
- 219 Bridgeport Dr Unit 35
- 134 Nebraska Ave
- 146 Nebraska Ave
- 143 Tennessee Ave
- 130 Nebraska Ave
- 421 Defiance Ave
- 149 Tennessee Ave
- 139 Tennessee Ave
- 407 Defiance Ave
- 137 Nebraska Ave
- 133 Tennessee Ave
- 143 Nebraska Ave
- 131 Nebraska Ave
- 124 Nebraska Ave
- 131 Nebraska Dr
- 437 Defiance Ave
- 127 Tennessee Ave
- 127 Nebraska Ave
- 118 Nebraska Ave
- 121 Nebraska Ave
- 121 Tennessee Ave
Your Personal Tour Guide
Ask me questions while you tour the home.