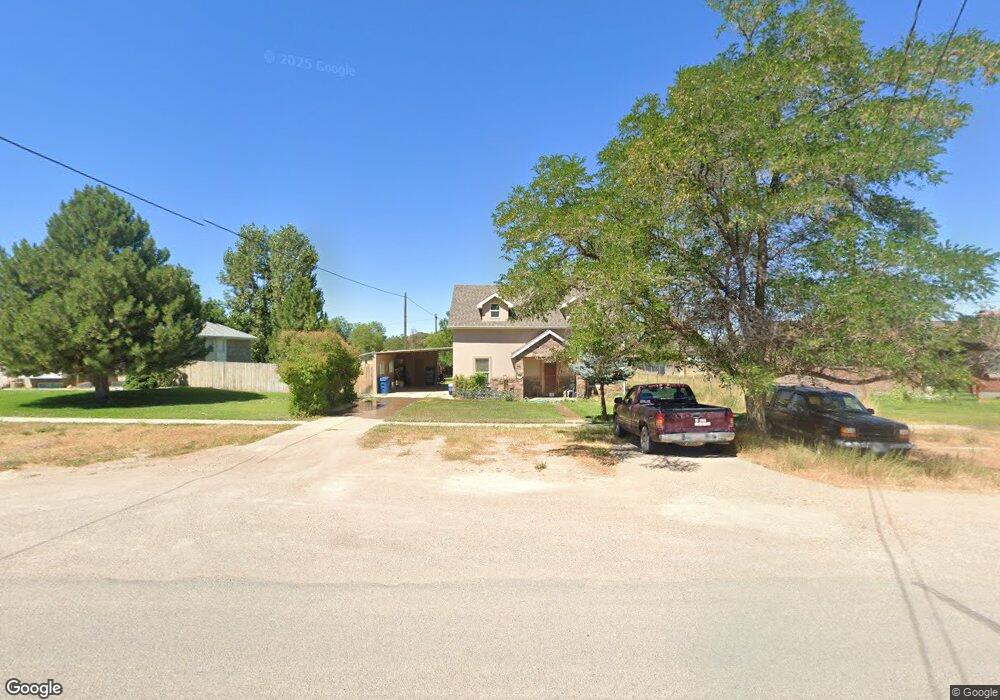
140 S 200 W Fillmore, UT 84631
Estimated Value: $220,000 - $310,083
--
Bed
--
Bath
--
Sq Ft
0.53
Acres
About This Home
This home is located at 140 S 200 W, Fillmore, UT 84631 and is currently estimated at $269,021. 140 S 200 W is a home.
Ownership History
Date
Name
Owned For
Owner Type
Purchase Details
Closed on
Oct 7, 2022
Sold by
Pierce Mark
Bought by
Pierce Mark and Pierce Julie D
Current Estimated Value
Home Financials for this Owner
Home Financials are based on the most recent Mortgage that was taken out on this home.
Original Mortgage
$206,000
Outstanding Balance
$197,179
Interest Rate
5.66%
Mortgage Type
New Conventional
Estimated Equity
$71,842
Purchase Details
Closed on
Sep 7, 2022
Sold by
Kimsey Dale B
Bought by
Pierce Mark A and Pierce Julie D
Home Financials for this Owner
Home Financials are based on the most recent Mortgage that was taken out on this home.
Original Mortgage
$206,000
Outstanding Balance
$197,179
Interest Rate
5.66%
Mortgage Type
New Conventional
Estimated Equity
$71,842
Purchase Details
Closed on
Mar 24, 2020
Sold by
Pierce Mark and Pierce Julie
Bought by
Kimsey Dale B
Create a Home Valuation Report for This Property
The Home Valuation Report is an in-depth analysis detailing your home's value as well as a comparison with similar homes in the area
Home Values in the Area
Average Home Value in this Area
Purchase History
| Date | Buyer | Sale Price | Title Company |
|---|---|---|---|
| Pierce Mark | -- | First American Title | |
| Pierce Mark | -- | First American Title | |
| Pierce Mark A | -- | First American Title | |
| Kimsey Dale B | -- | None Available |
Source: Public Records
Mortgage History
| Date | Status | Borrower | Loan Amount |
|---|---|---|---|
| Open | Pierce Mark | $206,000 | |
| Closed | Pierce Mark | $206,000 |
Source: Public Records
Tax History Compared to Growth
Tax History
| Year | Tax Paid | Tax Assessment Tax Assessment Total Assessment is a certain percentage of the fair market value that is determined by local assessors to be the total taxable value of land and additions on the property. | Land | Improvement |
|---|---|---|---|---|
| 2025 | -- | $149,270 | $29,839 | $119,431 |
| 2024 | $110,449 | $110,449 | $23,290 | $87,159 |
| 2023 | $1,221 | $110,449 | $23,290 | $87,159 |
| 2022 | $0 | $94,185 | $21,173 | $73,012 |
| 2021 | $0 | $78,069 | $13,749 | $64,320 |
| 2020 | $0 | $72,647 | $12,499 | $60,148 |
| 2019 | $0 | $62,586 | $12,499 | $50,087 |
| 2018 | $0 | $61,173 | $12,499 | $48,674 |
| 2017 | $0 | $49,895 | $12,499 | $37,396 |
| 2016 | -- | $49,895 | $12,499 | $37,396 |
| 2015 | -- | $49,895 | $12,499 | $37,396 |
| 2014 | -- | $49,895 | $12,499 | $37,396 |
| 2013 | -- | $49,895 | $12,499 | $37,396 |
Source: Public Records
Map
Nearby Homes