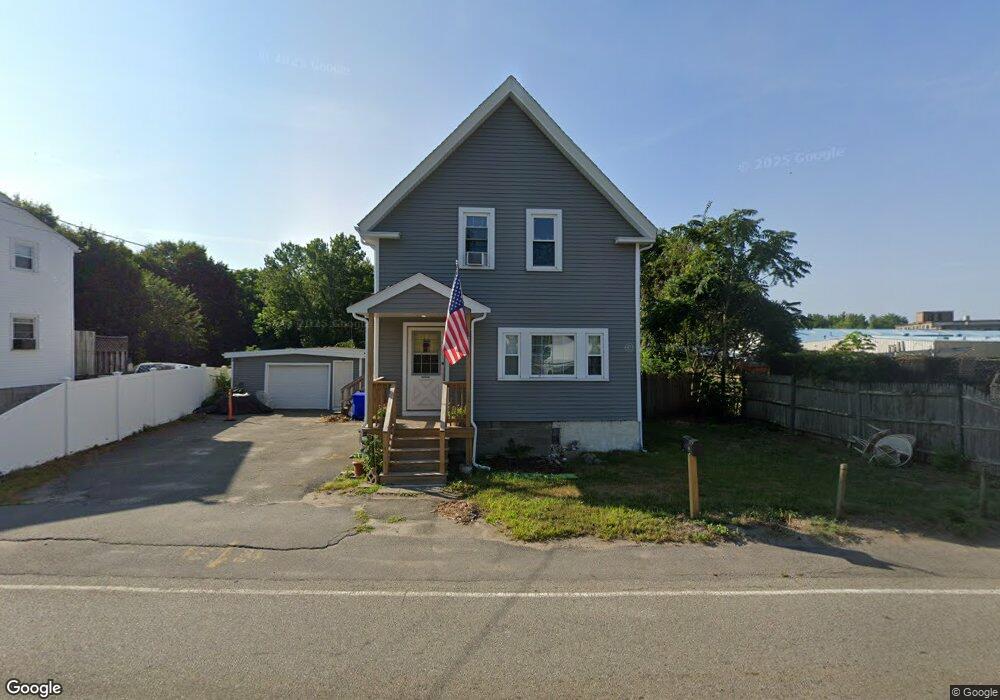
140 Spring St Holbrook, MA 02343
Estimated Value: $460,000 - $597,000
3
Beds
2
Baths
1,221
Sq Ft
$424/Sq Ft
Est. Value
About This Home
This home is located at 140 Spring St, Holbrook, MA 02343 and is currently estimated at $517,239, approximately $423 per square foot. 140 Spring St is a home located in Norfolk County with nearby schools including John F. Kennedy Elementary School and Holbrook Middle High School.
Ownership History
Date
Name
Owned For
Owner Type
Purchase Details
Closed on
Sep 30, 1994
Sold by
Feeney David J and Feeney Nancy A
Bought by
Maccallum Robert K and Maccallum Robin G
Current Estimated Value
Home Financials for this Owner
Home Financials are based on the most recent Mortgage that was taken out on this home.
Original Mortgage
$94,900
Interest Rate
8.5%
Mortgage Type
Purchase Money Mortgage
Create a Home Valuation Report for This Property
The Home Valuation Report is an in-depth analysis detailing your home's value as well as a comparison with similar homes in the area
Home Values in the Area
Average Home Value in this Area
Purchase History
| Date | Buyer | Sale Price | Title Company |
|---|---|---|---|
| Maccallum Robert K | $99,900 | -- | |
| Maccallum Robert K | $99,900 | -- |
Source: Public Records
Mortgage History
| Date | Status | Borrower | Loan Amount |
|---|---|---|---|
| Open | Maccallum Robert K | $130,000 | |
| Closed | Maccallum Robert K | $132,750 | |
| Closed | Maccallum Robert K | $95,000 | |
| Closed | Maccallum Robert K | $94,900 |
Source: Public Records
Tax History Compared to Growth
Tax History
| Year | Tax Paid | Tax Assessment Tax Assessment Total Assessment is a certain percentage of the fair market value that is determined by local assessors to be the total taxable value of land and additions on the property. | Land | Improvement |
|---|---|---|---|---|
| 2025 | $45 | $343,100 | $170,300 | $172,800 |
| 2024 | $4,109 | $305,700 | $145,600 | $160,100 |
| 2023 | $4,723 | $307,100 | $140,700 | $166,400 |
| 2022 | $4,454 | $270,100 | $122,400 | $147,700 |
| 2021 | $4,370 | $253,800 | $114,400 | $139,400 |
| 2020 | $4,506 | $245,300 | $111,100 | $134,200 |
| 2019 | $4,349 | $223,500 | $93,200 | $130,300 |
| 2018 | $4,477 | $216,600 | $90,500 | $126,100 |
| 2017 | $4,397 | $210,400 | $90,500 | $119,900 |
| 2016 | $3,895 | $198,300 | $83,200 | $115,100 |
| 2015 | $3,640 | $190,800 | $80,000 | $110,800 |
| 2014 | $3,581 | $190,800 | $80,000 | $110,800 |
Source: Public Records
Map
Nearby Homes
- 72 Spring St
- 70 Spring St
- 2 High St
- 68 Spring St
- 66 Spring St
- 55 High St
- 50 High St
- 62 Spring St
- 4 Spring Ln
- 2 Spring Ln
- 2 Spring Ln
- 8 Spring Ln
- 8 Spring Ln
- 12 Spring Ln
- 6 Christie's Way Unit 6
- 9 Christie's Way Unit 9
- 13 Christie's Way Unit 13
- 14 Christie's Way Unit 14
- 5 Cummings Way
- 17 Christies Way Unit 17