Estimated Value: $1,163,066 - $1,284,000
4
Beds
2
Baths
2,062
Sq Ft
$590/Sq Ft
Est. Value
About This Home
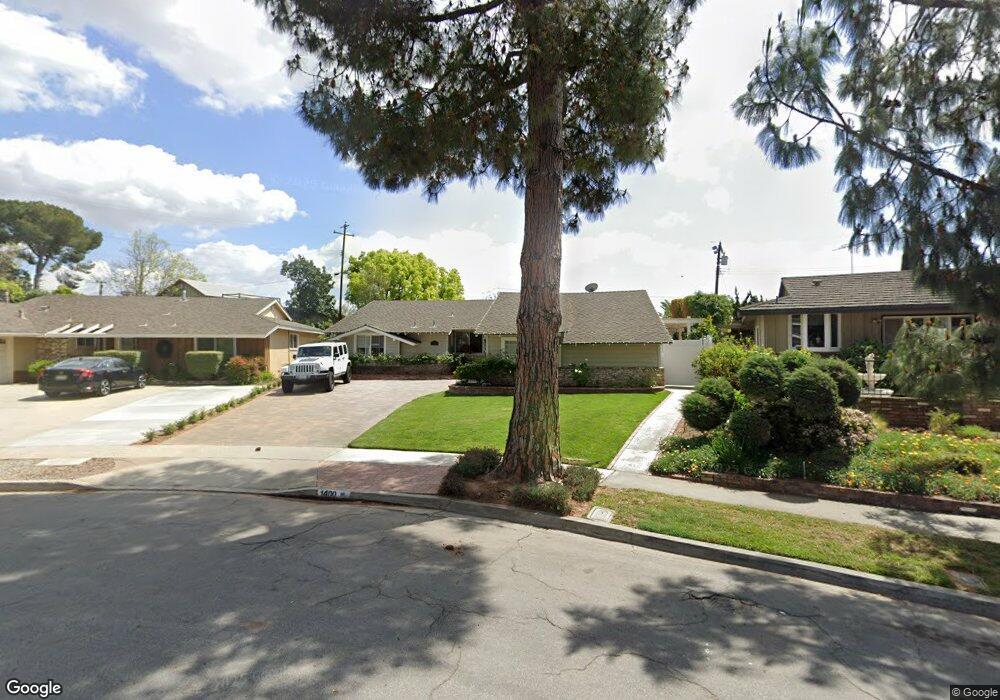
This home is located at 1400 Havenhurst Dr, Brea, CA 92821 and is currently estimated at $1,216,517, approximately $589 per square foot. 1400 Havenhurst Dr is a home located in Orange County with nearby schools including Sierra Vista Elementary School, Ladera Palma Elementary School, and Washington Middle School.
Ownership History
Date
Name
Owned For
Owner Type
Purchase Details
Closed on
Aug 24, 2010
Sold by
Ulibarri Allen H and Ulibarri Angella S
Bought by
Bergner Aaron and Bergner Diana
Current Estimated Value
Purchase Details
Closed on
Oct 23, 2001
Sold by
Mcintosh Robert Todd and Mcintosh Susan Ann
Bought by
Ulibarri Allen H and Ulibarri Angella S
Home Financials for this Owner
Home Financials are based on the most recent Mortgage that was taken out on this home.
Original Mortgage
$273,000
Interest Rate
6%
Purchase Details
Closed on
Apr 29, 1999
Sold by
Mcintosh Susan A
Bought by
Mcintosh Robert Todd and Mcintosh Susan Ann
Home Financials for this Owner
Home Financials are based on the most recent Mortgage that was taken out on this home.
Original Mortgage
$185,000
Interest Rate
6.96%
Create a Home Valuation Report for This Property
The Home Valuation Report is an in-depth analysis detailing your home's value as well as a comparison with similar homes in the area
Home Values in the Area
Average Home Value in this Area
Purchase History
| Date | Buyer | Sale Price | Title Company |
|---|---|---|---|
| Bergner Aaron | $576,000 | Fidelity National Title Co | |
| Ulibarri Allen H | $350,000 | Southland Title Corporation | |
| Mcintosh Robert Todd | -- | California Counties Title Co |
Source: Public Records
Mortgage History
| Date | Status | Borrower | Loan Amount |
|---|---|---|---|
| Previous Owner | Ulibarri Allen H | $273,000 | |
| Previous Owner | Mcintosh Robert Todd | $185,000 |
Source: Public Records
Tax History
| Year | Tax Paid | Tax Assessment Tax Assessment Total Assessment is a certain percentage of the fair market value that is determined by local assessors to be the total taxable value of land and additions on the property. | Land | Improvement |
|---|---|---|---|---|
| 2025 | $4,195 | $350,008 | $116,949 | $233,059 |
| 2024 | $4,195 | $343,146 | $114,656 | $228,490 |
| 2023 | $4,176 | $336,418 | $112,408 | $224,010 |
| 2022 | $4,050 | $329,822 | $110,204 | $219,618 |
| 2021 | $3,982 | $323,355 | $108,043 | $215,312 |
| 2020 | $3,944 | $320,040 | $106,935 | $213,105 |
| 2019 | $3,837 | $313,765 | $104,838 | $208,927 |
| 2018 | $3,771 | $307,613 | $102,782 | $204,831 |
| 2017 | $3,703 | $301,582 | $100,767 | $200,815 |
| 2016 | $3,616 | $295,669 | $98,791 | $196,878 |
| 2015 | $3,514 | $291,228 | $97,307 | $193,921 |
| 2014 | $3,411 | $285,524 | $95,401 | $190,123 |
Source: Public Records
Map
Nearby Homes
- 450 Palermo Way
- 1209 N Puente St
- 1406 Carey Ave
- 1308 Las Lomas Dr
- 1400 N Puente St
- 1215 Wardman Dr
- 751 Village Lake Mall
- 1414 W Central Ave Unit 81
- 1414 W Central Ave Unit 10
- 1414 W Central Ave Unit 19
- 1020 Joyce Dr
- 1060 Tropicana Way
- 736 Terrace Lake Dr Unit 324
- 736 Knoll Lake Dr Unit 266
- 912 Bonnie Way
- 1235 Harbor Lake Ave Unit 13
- 1381 Harbor Lake Ave Unit 32
- 675 Wood Lake Dr Unit 186
- 846 Mooncrest Cir
- 655 Wood Lake Dr Unit 190
- 1404 Havenhurst Dr
- 1100 Havenhurst Dr
- 1341 Southridge Dr
- 1335 Southridge Dr
- 1401 Southridge Dr
- 1410 Havenhurst Dr
- 1104 Havenhurst Dr
- 1329 Southridge Dr
- 1405 Southridge Dr
- 1318 Rutledge Place
- 1107 Havenhurst Dr
- 1325 Southridge Dr
- 1416 Havenhurst Dr
- 1108 Havenhurst Dr
- 1322 Rutledge Place
- 1409 Southridge Dr
- 1409 Havenhurst Dr
- 1420 Havenhurst Dr
- 1319 Southridge Dr
- 1116 Havenhurst Dr
Your Personal Tour Guide
Ask me questions while you tour the home.