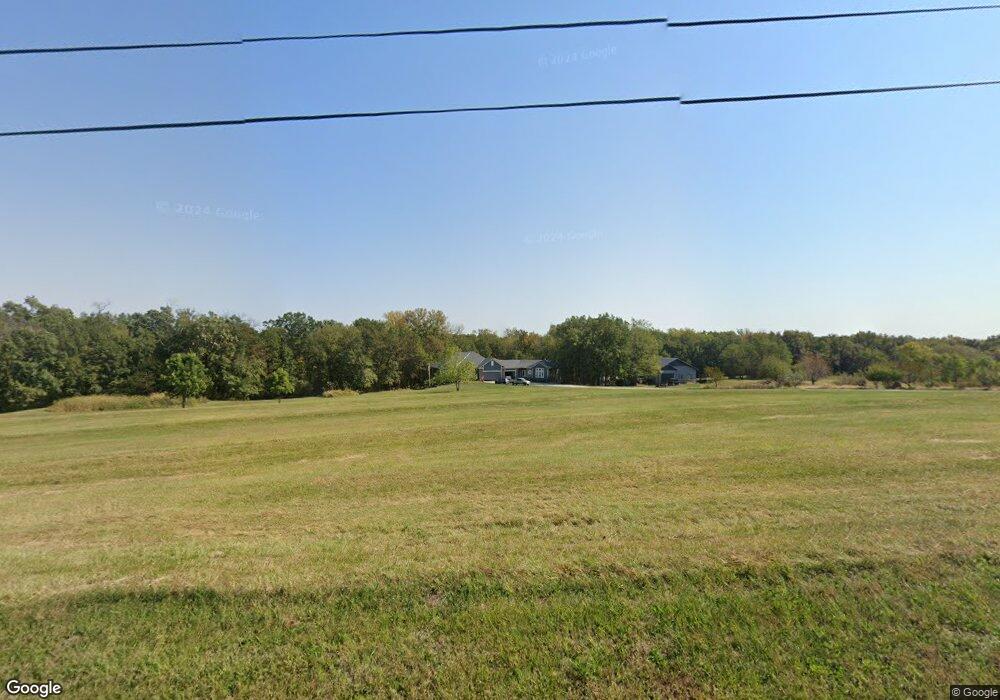
14005 S Outer Belt Extension Lone Jack, MO 64070
Estimated Value: $690,128 - $759,000
4
Beds
3
Baths
1,588
Sq Ft
$456/Sq Ft
Est. Value
About This Home
This home is located at 14005 S Outer Belt Extension, Lone Jack, MO 64070 and is currently estimated at $724,564, approximately $456 per square foot. 14005 S Outer Belt Extension is a home located in Jackson County with nearby schools including Lone Jack Elementary School and Lone Jack High School.
Ownership History
Date
Name
Owned For
Owner Type
Purchase Details
Closed on
Oct 29, 2012
Sold by
Pulver David J and Pulver Karen S
Bought by
Sanders Todd and Sanders Beth
Current Estimated Value
Home Financials for this Owner
Home Financials are based on the most recent Mortgage that was taken out on this home.
Original Mortgage
$31,800
Interest Rate
3.52%
Mortgage Type
Stand Alone Second
Purchase Details
Closed on
Jan 29, 2007
Sold by
Sloan Cynthia L and Farris Cynthia
Bought by
Pulver David J and Pulver Karen S
Home Financials for this Owner
Home Financials are based on the most recent Mortgage that was taken out on this home.
Original Mortgage
$215,000
Interest Rate
6.11%
Mortgage Type
Purchase Money Mortgage
Purchase Details
Closed on
Apr 10, 2006
Sold by
Farris Gregory and Farris Gregory C
Bought by
Farris Cynthia and Farris Cynthia L
Home Financials for this Owner
Home Financials are based on the most recent Mortgage that was taken out on this home.
Original Mortgage
$211,200
Interest Rate
6.32%
Mortgage Type
Fannie Mae Freddie Mac
Create a Home Valuation Report for This Property
The Home Valuation Report is an in-depth analysis detailing your home's value as well as a comparison with similar homes in the area
Purchase History
| Date | Buyer | Sale Price | Title Company |
|---|---|---|---|
| Sanders Todd | -- | None Available | |
| Pulver David J | -- | Ctic | |
| Farris Cynthia | -- | Coffelt Land Title Inc |
Source: Public Records
Mortgage History
| Date | Status | Borrower | Loan Amount |
|---|---|---|---|
| Closed | Sanders Todd | $31,800 | |
| Previous Owner | Pulver David J | $215,000 | |
| Previous Owner | Farris Cynthia | $211,200 |
Source: Public Records
Tax History
| Year | Tax Paid | Tax Assessment Tax Assessment Total Assessment is a certain percentage of the fair market value that is determined by local assessors to be the total taxable value of land and additions on the property. | Land | Improvement |
|---|---|---|---|---|
| 2025 | $5,147 | $86,549 | $14,839 | $71,710 |
| 2024 | $5,025 | $75,230 | $3,384 | $71,846 |
| 2023 | $5,025 | $86,015 | $3,593 | $82,422 |
| 2022 | $5,617 | $73,900 | $2,244 | $71,656 |
| 2021 | $5,464 | $73,900 | $2,244 | $71,656 |
| 2020 | $5,550 | $73,808 | $2,244 | $71,564 |
| 2019 | $5,527 | $73,808 | $2,244 | $71,564 |
| 2018 | $3,392 | $44,760 | $2,251 | $42,509 |
| 2017 | $3,392 | $44,760 | $2,251 | $42,509 |
| 2016 | $3,025 | $39,713 | $2,251 | $37,462 |
Source: Public Records
Map
Nearby Homes
- 14913 S Outer Belt Extension
- 1960 NW 550th Rd
- 12911 S Al Gossett Rd
- 38305 E 155th St
- 12614 S Al Gossett Rd
- 207 Black Jack Ave
- 511 NW 1891st Rd
- 308 Oak St
- 205 E Woodland Ave
- 532 NW Aa Hwy
- 36404 E County Line Rd
- 117 E Maple St
- 110 Woodland Ave
- 106 E Woodland Ave
- 1933 NW 370th Rd
- 403 NW Aa Hwy
- 0 NW 550th Rd
- 15204 S Stewart Rd
- 13003 S Outer Belt Rd
- 34506 E Stewart Rd
- 14005 S Outer Belt Extension
- 13919 S Outer Belt Extension
- 14119 S Outer Belt Extension
- 13907 S Outer Belt Extension
- 13904 S Outer Belt Extension
- 13711 S Hutt Rd
- 13816 S Outer Belt Rd
- 13816 Outer Belt Extension
- 14206 S Outer Belt Extension
- 13806 S Outer Belt Rd
- 14308 S Outer Belt Rd
- 13808 S Outer Belt Rd
- 14319 S Outer Belt Extension
- 13712 S Outer Belt Extension
- 14405 S Outer Belt Extension
- 13908 S Sam Moore Rd
- 14419 S Outer Belt Extension
- 14410 S Outer Belt Extension
- 13617 S Outer Belt Extension
- 39004 E Boswell Rd
Your Personal Tour Guide
Ask me questions while you tour the home.