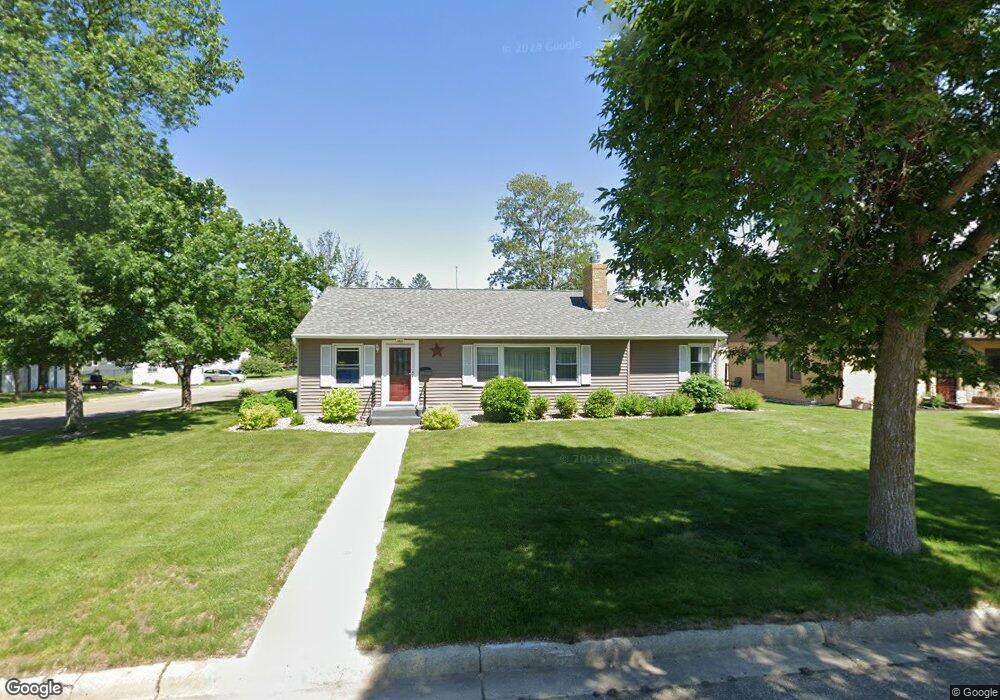
1401 Bryant St Alexandria, MN 56308
Estimated Value: $280,000 - $344,000
--
Bed
--
Bath
1,448
Sq Ft
$211/Sq Ft
Est. Value
About This Home
This home is located at 1401 Bryant St, Alexandria, MN 56308 and is currently estimated at $305,756, approximately $211 per square foot. 1401 Bryant St is a home located in Douglas County with nearby schools including Lincoln Elementary School, Discovery Middle School, and Alexandria Area High School.
Ownership History
Date
Name
Owned For
Owner Type
Purchase Details
Closed on
Jul 28, 2006
Sold by
Sieve Kurt A and The Helen R Sieve Irrevocable
Bought by
Bisel Franklin J and Bisel Carolyn D
Current Estimated Value
Home Financials for this Owner
Home Financials are based on the most recent Mortgage that was taken out on this home.
Original Mortgage
$100,500
Outstanding Balance
$60,240
Interest Rate
6.73%
Mortgage Type
New Conventional
Estimated Equity
$245,516
Purchase Details
Closed on
May 10, 2005
Sold by
Sieve Helen R and Sieve Helen B
Bought by
Sieve Kurt A and The Helen R Sieve Irrevocable Trust
Create a Home Valuation Report for This Property
The Home Valuation Report is an in-depth analysis detailing your home's value as well as a comparison with similar homes in the area
Home Values in the Area
Average Home Value in this Area
Purchase History
| Date | Buyer | Sale Price | Title Company |
|---|---|---|---|
| Bisel Franklin J | -- | None Available | |
| Sieve Kurt A | -- | None Available |
Source: Public Records
Mortgage History
| Date | Status | Borrower | Loan Amount |
|---|---|---|---|
| Open | Bisel Franklin J | $100,500 |
Source: Public Records
Tax History Compared to Growth
Tax History
| Year | Tax Paid | Tax Assessment Tax Assessment Total Assessment is a certain percentage of the fair market value that is determined by local assessors to be the total taxable value of land and additions on the property. | Land | Improvement |
|---|---|---|---|---|
| 2025 | $2,466 | $302,400 | $46,600 | $255,800 |
| 2024 | $2,466 | $255,900 | $44,400 | $211,500 |
| 2023 | $2,496 | $239,000 | $44,400 | $194,600 |
| 2022 | $2,246 | $215,600 | $41,100 | $174,500 |
| 2021 | $2,150 | $195,100 | $41,100 | $154,000 |
| 2020 | $2,108 | $185,000 | $41,100 | $143,900 |
| 2019 | $1,964 | $177,400 | $41,100 | $136,300 |
| 2018 | $1,816 | $170,400 | $41,100 | $129,300 |
| 2017 | $1,698 | $162,200 | $41,100 | $121,100 |
| 2016 | $1,702 | $152,290 | $40,934 | $111,356 |
| 2015 | $1,654 | $0 | $0 | $0 |
| 2014 | -- | $143,900 | $42,200 | $101,700 |
Source: Public Records
Map
Nearby Homes