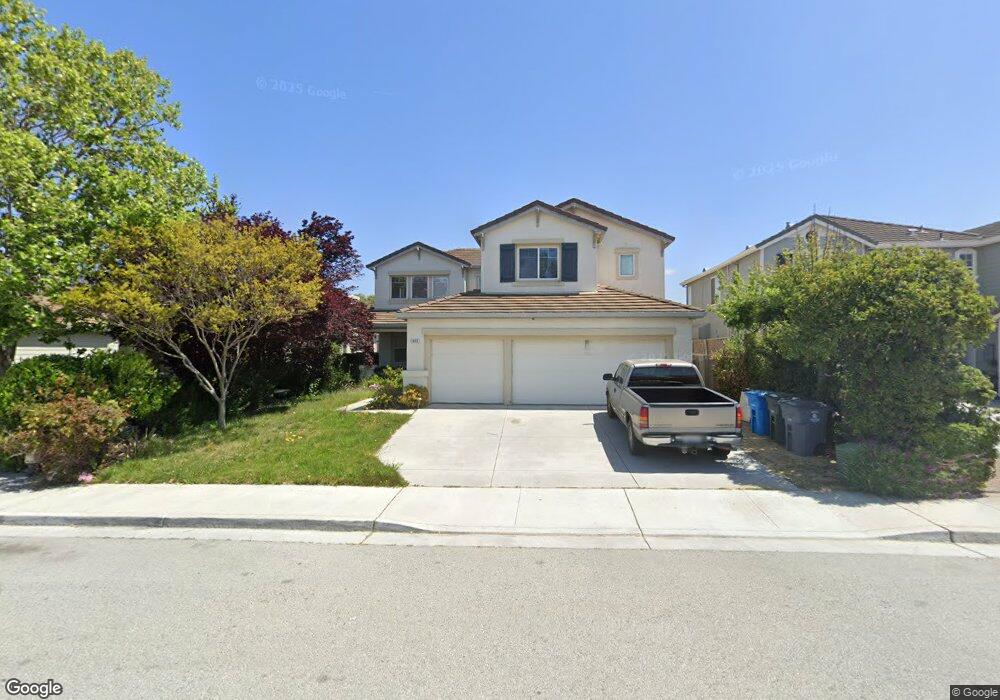
1401 Freedom Dr Hollister, CA 95023
Estimated Value: $698,000 - $763,000
4
Beds
2
Baths
1,777
Sq Ft
$409/Sq Ft
Est. Value
About This Home
This home is located at 1401 Freedom Dr, Hollister, CA 95023 and is currently estimated at $726,838, approximately $409 per square foot. 1401 Freedom Dr is a home located in San Benito County with nearby schools including Sunnyslope Elementary School, Rancho San Justo School, and San Benito High School.
Ownership History
Date
Name
Owned For
Owner Type
Purchase Details
Closed on
Apr 30, 2024
Sold by
Garcia Rocio and Garcia Jose J
Bought by
Rojo Bliss Llc
Current Estimated Value
Purchase Details
Closed on
Oct 29, 2010
Sold by
Garcia Jose J and Garcia Rocio
Bought by
Wells Fargo Bank Na
Purchase Details
Closed on
Oct 8, 2001
Sold by
Martinez Ramiro and Martinez Elsa P
Bought by
Garcia Jose J and Garcia Rocio
Home Financials for this Owner
Home Financials are based on the most recent Mortgage that was taken out on this home.
Original Mortgage
$275,000
Interest Rate
6.88%
Purchase Details
Closed on
Dec 3, 1999
Sold by
Heritage Village Assoc Llc
Bought by
Martinez Ramiro and Martinez Elsa P
Home Financials for this Owner
Home Financials are based on the most recent Mortgage that was taken out on this home.
Original Mortgage
$256,806
Interest Rate
7.96%
Create a Home Valuation Report for This Property
The Home Valuation Report is an in-depth analysis detailing your home's value as well as a comparison with similar homes in the area
Home Values in the Area
Average Home Value in this Area
Purchase History
| Date | Buyer | Sale Price | Title Company |
|---|---|---|---|
| Rojo Bliss Llc | -- | None Listed On Document | |
| Wells Fargo Bank Na | $296,873 | Accommodation | |
| Garcia Jose J | -- | Chicago Title Co | |
| Martinez Ramiro | $285,500 | Stewart Title |
Source: Public Records
Mortgage History
| Date | Status | Borrower | Loan Amount |
|---|---|---|---|
| Previous Owner | Garcia Jose J | $275,000 | |
| Previous Owner | Martinez Ramiro | $256,806 |
Source: Public Records
Tax History Compared to Growth
Tax History
| Year | Tax Paid | Tax Assessment Tax Assessment Total Assessment is a certain percentage of the fair market value that is determined by local assessors to be the total taxable value of land and additions on the property. | Land | Improvement |
|---|---|---|---|---|
| 2025 | $5,823 | $438,549 | $141,393 | $297,156 |
| 2023 | $5,823 | $421,521 | $135,903 | $285,618 |
| 2022 | $5,619 | $413,257 | $133,239 | $280,018 |
| 2021 | $5,526 | $405,155 | $130,627 | $274,528 |
| 2020 | $5,462 | $401,002 | $129,288 | $271,714 |
| 2019 | $5,382 | $393,140 | $126,753 | $266,387 |
| 2018 | $5,250 | $385,432 | $124,268 | $261,164 |
| 2017 | $5,171 | $377,876 | $121,832 | $256,044 |
| 2016 | $4,877 | $370,468 | $119,444 | $251,024 |
| 2015 | $4,784 | $364,904 | $117,650 | $247,254 |
| 2014 | $4,514 | $357,757 | $115,346 | $242,411 |
Source: Public Records
Map
Nearby Homes
- 1101 Freedom Dr
- 841 Calais Dr
- 1573 Valley View Rd
- 1941 Memorial Dr
- 1231 Westward Dr
- 650 Talbot Dr
- 1671 Monticello Dr
- 1120 Richard Rd
- 1361 Westward Dr
- 740 Alissa Ct
- 1150 Bonnie View Rd
- 2141 White Oak Dr
- 2171 White Oak Dr
- 420 Mary Dr Unit 37
- 425 Mary Dr
- 981 Marne Dr
- 1590 Diablo Dr
- 291 Slate Ave
- 350 Tina Dr
- 1180 Cherry Peak Way
- 1351 Freedom Dr
- 1451 Freedom Dr
- 1301 Freedom Dr
- 1501 Freedom Dr
- 1630 Memorial Dr
- 1620 Memorial Dr
- 1640 Memorial Dr
- 1851 Black Forest Dr
- 1251 Freedom Dr
- 1551 Freedom Dr
- 1610 Memorial Dr
- 1650 Memorial Dr
- 1850 Black Forest Dr
- 890 Victory Dr
- 1841 Black Forest Dr
- 1201 Freedom Dr
- 1600 Memorial Dr
- 1601 Freedom Dr
- 1840 Black Forest Dr
- 1660 Memorial Dr