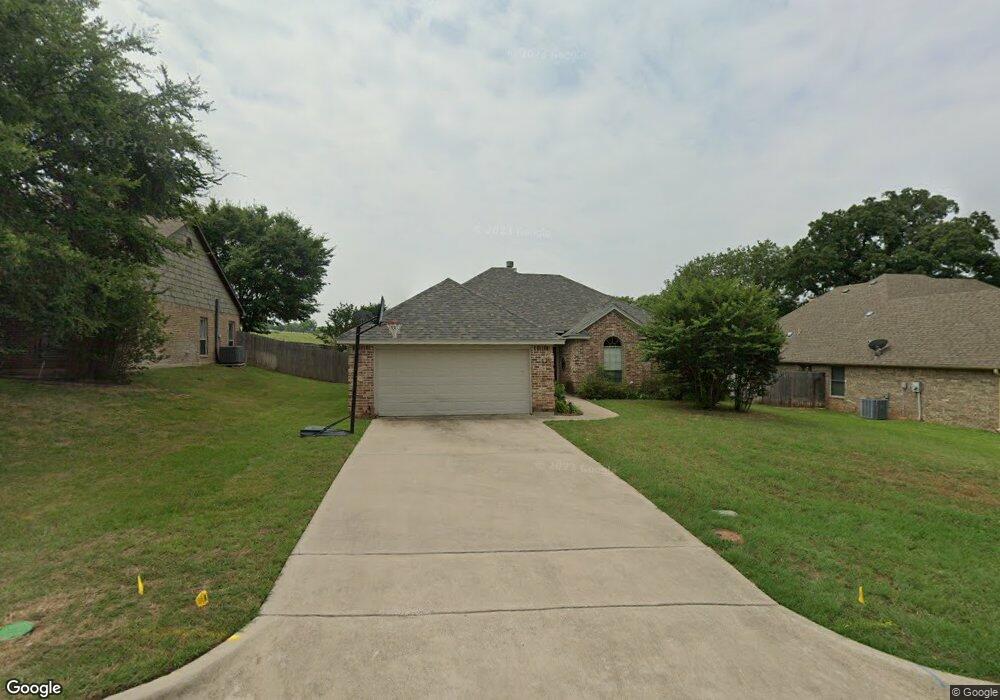
1401 Rodden Dr Decatur, TX 76234
Estimated Value: $319,951 - $385,000
3
Beds
3
Baths
1,869
Sq Ft
$194/Sq Ft
Est. Value
About This Home
This home is located at 1401 Rodden Dr, Decatur, TX 76234 and is currently estimated at $363,488, approximately $194 per square foot. 1401 Rodden Dr is a home located in Wise County with nearby schools including Decatur High School and Victory Christian Academy.
Ownership History
Date
Name
Owned For
Owner Type
Purchase Details
Closed on
Aug 25, 2017
Sold by
Tonroy Douglas Bart and Tonroy Andra M
Bought by
Bryan Florence Davis O
Current Estimated Value
Purchase Details
Closed on
Oct 12, 2011
Sold by
Hill Teresa
Bought by
Tonroy Douglas and Tonroy Andra
Purchase Details
Closed on
Jul 27, 2009
Sold by
Nelson Thomas and Nelson Lisa
Bought by
Hill Teresa
Home Financials for this Owner
Home Financials are based on the most recent Mortgage that was taken out on this home.
Original Mortgage
$160,256
Interest Rate
5.41%
Mortgage Type
FHA
Purchase Details
Closed on
Apr 28, 2004
Sold by
Larry Henry Enterprises Inc
Bought by
Tonroy Douglas and Tonroy Andra
Purchase Details
Closed on
Apr 10, 2000
Sold by
Rodden Devel Corp
Bought by
Tonroy Douglas and Tonroy Andra
Purchase Details
Closed on
Dec 31, 1996
Bought by
Tonroy Douglas and Tonroy Andra
Create a Home Valuation Report for This Property
The Home Valuation Report is an in-depth analysis detailing your home's value as well as a comparison with similar homes in the area
Home Values in the Area
Average Home Value in this Area
Purchase History
| Date | Buyer | Sale Price | Title Company |
|---|---|---|---|
| Bryan Florence Davis O | -- | Guardian Title Co | |
| Tonroy Douglas | -- | -- | |
| Hill Teresa | -- | -- | |
| Tonroy Douglas | -- | -- | |
| Tonroy Douglas | -- | -- | |
| Tonroy Douglas | -- | -- |
Source: Public Records
Mortgage History
| Date | Status | Borrower | Loan Amount |
|---|---|---|---|
| Previous Owner | Hill Teresa | $160,256 |
Source: Public Records
Tax History Compared to Growth
Tax History
| Year | Tax Paid | Tax Assessment Tax Assessment Total Assessment is a certain percentage of the fair market value that is determined by local assessors to be the total taxable value of land and additions on the property. | Land | Improvement |
|---|---|---|---|---|
| 2025 | $2,401 | $325,441 | $41,644 | $283,797 |
| 2024 | $2,401 | $325,189 | $0 | $0 |
| 2023 | $5,363 | $295,626 | $0 | $0 |
| 2022 | $5,885 | $268,751 | $0 | $0 |
| 2021 | $5,576 | $244,320 | $41,640 | $202,680 |
| 2020 | $5,431 | $231,570 | $41,640 | $189,930 |
| 2019 | $5,293 | $215,340 | $41,640 | $173,700 |
| 2018 | $5,020 | $194,150 | $23,430 | $170,720 |
| 2017 | $4,793 | $184,680 | $23,430 | $161,250 |
| 2016 | $4,408 | $169,830 | $23,430 | $146,400 |
| 2015 | -- | $162,570 | $23,430 | $139,140 |
| 2014 | -- | $142,040 | $23,430 | $118,610 |
Source: Public Records
Map
Nearby Homes
- 1405 Rodden Dr
- 808 Sage Dr
- 400 S Vick St
- 1234 Rockwater Dr
- 1216 Marsha Ln
- 1232 Marsha Ln
- 1215 Rockwater Dr
- 1224 Patti Ln
- 1 Vista Dr
- LEXINGTON Plan at Vista Park
- OXFORD Plan at Vista Park
- NATCHEZ Plan at Vista Park
- KENNEDY Plan at Vista Park
- MACON Plan at Vista Park
- STARKVILLE Plan at Vista Park
- SOUTHHAVEN Plan at Vista Park
- 1240 Marsha Ln
- 1202 W Thompson St Unit Land
- W W Rose Ave
- 0 N Hwy 287 Unit 25379920