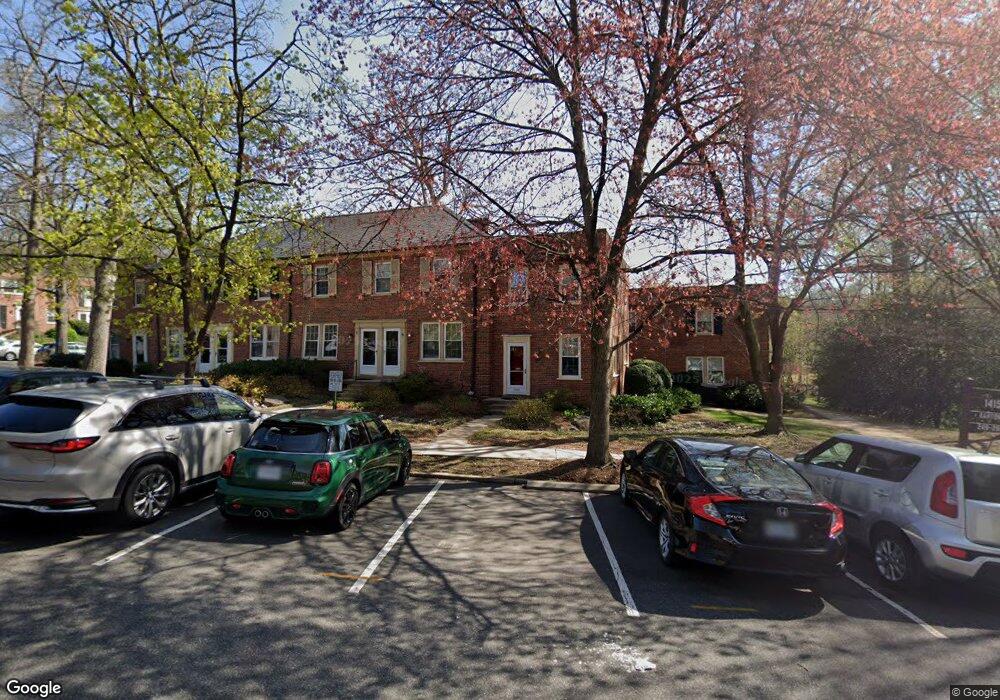
1401 S Barton St Unit 235 Arlington, VA 22204
Arlington Village NeighborhoodEstimated Value: $349,000 - $366,000
1
Bed
1
Bath
844
Sq Ft
$426/Sq Ft
Est. Value
About This Home
This home is located at 1401 S Barton St Unit 235, Arlington, VA 22204 and is currently estimated at $359,708, approximately $426 per square foot. 1401 S Barton St Unit 235 is a home located in Arlington County with nearby schools including Dr. Charles R. Drew Elementary, Thomas Jefferson Middle School, and Wakefield High School.
Ownership History
Date
Name
Owned For
Owner Type
Purchase Details
Closed on
Mar 8, 2011
Sold by
Ferramosca Nicholina D
Bought by
Gibbons Ruth E
Current Estimated Value
Home Financials for this Owner
Home Financials are based on the most recent Mortgage that was taken out on this home.
Original Mortgage
$195,000
Outstanding Balance
$134,237
Interest Rate
4.83%
Mortgage Type
New Conventional
Estimated Equity
$225,471
Purchase Details
Closed on
Feb 23, 2007
Sold by
Mattingly Kathryn
Bought by
Ferramosca Nicholina
Home Financials for this Owner
Home Financials are based on the most recent Mortgage that was taken out on this home.
Original Mortgage
$248,000
Interest Rate
6.23%
Mortgage Type
New Conventional
Purchase Details
Closed on
Oct 3, 1994
Sold by
Fields Donna S
Bought by
Mattingly Kathryn A
Home Financials for this Owner
Home Financials are based on the most recent Mortgage that was taken out on this home.
Original Mortgage
$87,400
Interest Rate
8.5%
Create a Home Valuation Report for This Property
The Home Valuation Report is an in-depth analysis detailing your home's value as well as a comparison with similar homes in the area
Home Values in the Area
Average Home Value in this Area
Purchase History
| Date | Buyer | Sale Price | Title Company |
|---|---|---|---|
| Gibbons Ruth E | $260,000 | -- | |
| Ferramosca Nicholina | $310,000 | -- | |
| Mattingly Kathryn A | $92,000 | -- |
Source: Public Records
Mortgage History
| Date | Status | Borrower | Loan Amount |
|---|---|---|---|
| Open | Gibbons Ruth E | $195,000 | |
| Previous Owner | Ferramosca Nicholina | $248,000 | |
| Previous Owner | Mattingly Kathryn A | $87,400 |
Source: Public Records
Tax History Compared to Growth
Tax History
| Year | Tax Paid | Tax Assessment Tax Assessment Total Assessment is a certain percentage of the fair market value that is determined by local assessors to be the total taxable value of land and additions on the property. | Land | Improvement |
|---|---|---|---|---|
| 2025 | $3,552 | $343,900 | $49,000 | $294,900 |
| 2024 | $3,523 | $341,000 | $49,000 | $292,000 |
| 2023 | $3,468 | $336,700 | $49,000 | $287,700 |
| 2022 | $3,381 | $328,300 | $49,000 | $279,300 |
| 2021 | $3,298 | $320,200 | $49,000 | $271,200 |
| 2020 | $3,153 | $307,300 | $33,800 | $273,500 |
| 2019 | $3,071 | $299,300 | $33,800 | $265,500 |
| 2018 | $2,933 | $291,600 | $33,800 | $257,800 |
| 2017 | $2,882 | $286,500 | $33,800 | $252,700 |
| 2016 | $2,916 | $294,300 | $33,800 | $260,500 |
| 2015 | $2,931 | $294,300 | $33,800 | $260,500 |
| 2014 | $2,832 | $284,300 | $33,800 | $250,500 |
Source: Public Records
Map
Nearby Homes
- 1400 S Barton St Unit 425
- 1500 S Barton St Unit 595
- 1415 S Edgewood St Unit 458
- 1415 S Edgewood St Unit 463
- 2600 16th St S Unit 711
- 2600 16th St S Unit 696
- 1400 S Edgewood St Unit 527
- 2904 13th Rd S Unit 301
- 1021 S Barton St Unit 120
- 1016 S Wayne St Unit 604
- 2807 16th Rd S Unit A
- 1315 S Walter Reed Dr Unit 204
- 1317 S Walter Reed Dr Unit 17201
- 3202 13th Rd S
- 3135 14th St S
- 3115 19th St S
- 1334 S Quinn St
- 1830 Columbia Pike Unit 207
- 1830 Columbia Pike Unit 409
- 1308 S Quinn St
- 1401 S Barton St Unit 215
- 1401 S Barton St Unit 230
- 1401 S Barton St Unit 248
- 1401 S Barton St Unit 228
- 1401 S Barton St Unit 216
- 1401 S Barton St Unit 231
- 1401 S Barton St Unit 233
- 1401 S Barton St Unit 237
- 1401 S Barton St Unit 220
- 1401 S Barton St Unit 221
- 1401 S Barton St Unit 239
- 1401 S Barton St Unit 225
- 1401 S Barton St Unit 226
- 1401 S Barton St Unit 240
- 1401 S Barton St Unit 242
- 1401 S Barton St Unit 247
- 1401 S Barton St Unit 236
- 1401 S Barton St Unit 241
- 1401 S Barton St Unit 222
- 1401 S Barton St Unit 246