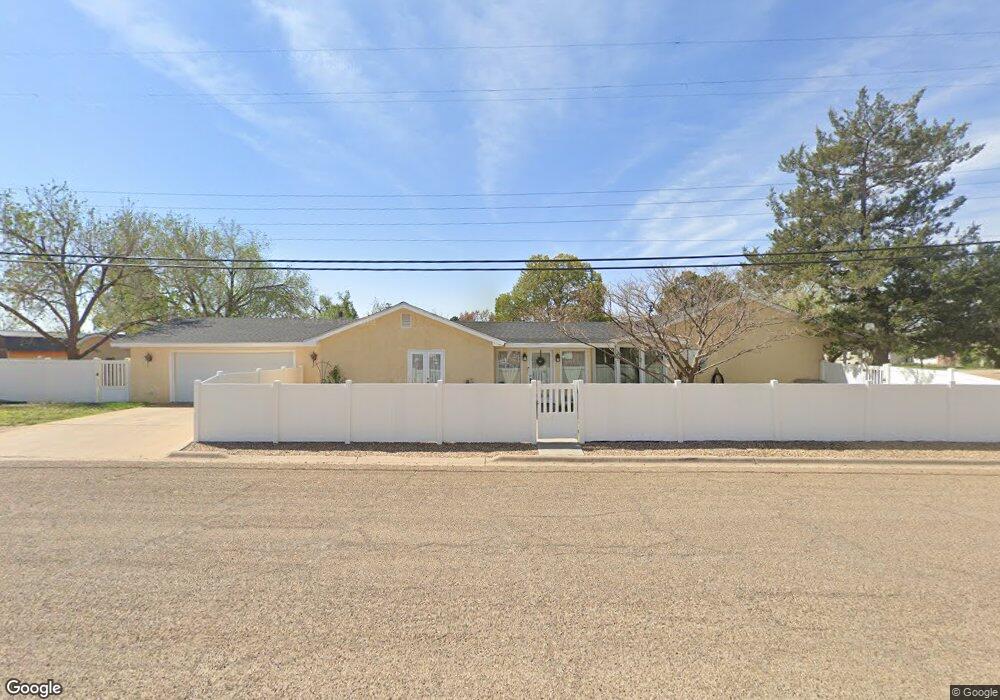
1401 S Main Ave Portales, NM 88130
Estimated Value: $238,272 - $271,000
--
Bed
--
Bath
2,727
Sq Ft
$95/Sq Ft
Est. Value
About This Home
This home is located at 1401 S Main Ave, Portales, NM 88130 and is currently estimated at $258,818, approximately $94 per square foot. 1401 S Main Ave is a home located in Roosevelt County with nearby schools including Brown Early Childhood Center, Valencia Elementary School, and James Elementary School.
Ownership History
Date
Name
Owned For
Owner Type
Purchase Details
Closed on
Oct 19, 2007
Sold by
Simmons Natasha D and Valdez Natasha D
Bought by
Jones Kathy L
Current Estimated Value
Purchase Details
Closed on
Jan 20, 2005
Sold by
Valdez Jeremy C and Valdez Natasha D
Bought by
Valdez Natasha D
Home Financials for this Owner
Home Financials are based on the most recent Mortgage that was taken out on this home.
Original Mortgage
$112,000
Interest Rate
10.05%
Mortgage Type
Adjustable Rate Mortgage/ARM
Purchase Details
Closed on
Dec 27, 2004
Sold by
Hockett Ronald L and Hockett Michelle M
Bought by
Valdez Jeremy C and Valdez Natasha D
Home Financials for this Owner
Home Financials are based on the most recent Mortgage that was taken out on this home.
Original Mortgage
$112,000
Interest Rate
10.05%
Mortgage Type
Adjustable Rate Mortgage/ARM
Create a Home Valuation Report for This Property
The Home Valuation Report is an in-depth analysis detailing your home's value as well as a comparison with similar homes in the area
Home Values in the Area
Average Home Value in this Area
Purchase History
| Date | Buyer | Sale Price | Title Company |
|---|---|---|---|
| Jones Kathy L | -- | Graham Title Company | |
| Valdez Natasha D | -- | Graham Title Company | |
| Valdez Jeremy C | -- | Graham Title Company |
Source: Public Records
Mortgage History
| Date | Status | Borrower | Loan Amount |
|---|---|---|---|
| Previous Owner | Valdez Natasha D | $112,000 | |
| Previous Owner | Valdez Jeremy C | $28,000 |
Source: Public Records
Tax History Compared to Growth
Tax History
| Year | Tax Paid | Tax Assessment Tax Assessment Total Assessment is a certain percentage of the fair market value that is determined by local assessors to be the total taxable value of land and additions on the property. | Land | Improvement |
|---|---|---|---|---|
| 2025 | $1,395 | $56,658 | $3,689 | $52,969 |
| 2024 | $1,395 | $55,009 | $3,617 | $51,392 |
| 2023 | $1,395 | $53,407 | $3,534 | $49,873 |
| 2022 | $1,264 | $51,851 | $3,453 | $48,398 |
| 2021 | $1,225 | $50,341 | $3,323 | $47,018 |
| 2020 | $1,193 | $48,875 | $3,091 | $45,784 |
| 2019 | $1,159 | $47,452 | $2,867 | $44,585 |
| 2018 | $1,128 | $46,069 | $2,648 | $43,421 |
| 2017 | $1,096 | $44,728 | $2,437 | $42,291 |
| 2016 | $1,083 | $43,425 | $2,231 | $41,194 |
| 2015 | $1,029 | $42,161 | $2,032 | $40,129 |
| 2011 | -- | $0 | $0 | $0 |
Source: Public Records
Map
Nearby Homes
- 1315 S Main Ave
- 1300 S Main Ave
- 1316 S Avenue A
- 1504 S Globe Ave
- 1009 S Main Ave
- 300 E 16th St
- 115 E 17th Ln
- 1600 S Avenue C
- 400 E 17th St
- 320 E 17th Ln
- 617 S Avenue A
- 1805 S Main Place
- 507 E 16th St
- 1128 Aquarius Dr
- 408 E 17th Ln
- 500 S Avenue A
- 1335 S Avenue F
- 417 Monticello Parkway Dr
- 516 E 17th St
- 113 & 115.5 E 5th St
- 103 E 14th St
- 1415 S Main Ave
- 1400 S Abilene Ave
- 1317 S Main Ave
- 1400 S Main Ave
- 1324 S Abilene Ave
- 1406 S Main Ave
- 1408 S Main Ave
- 1412 S Abilene Ave
- 1417 S Main Ave
- 1324 S Main Ave
- 1320 S Main Ave
- 1312 S Abilene Ave
- 1401 S Abilene Ave
- 1424 S Abilene Ave
- 1421 S Main Ave
- 121 W 14th St
- 1316 S Main Ave
- 1413 S Abilene Ave
- 1411 S Abilene Ave