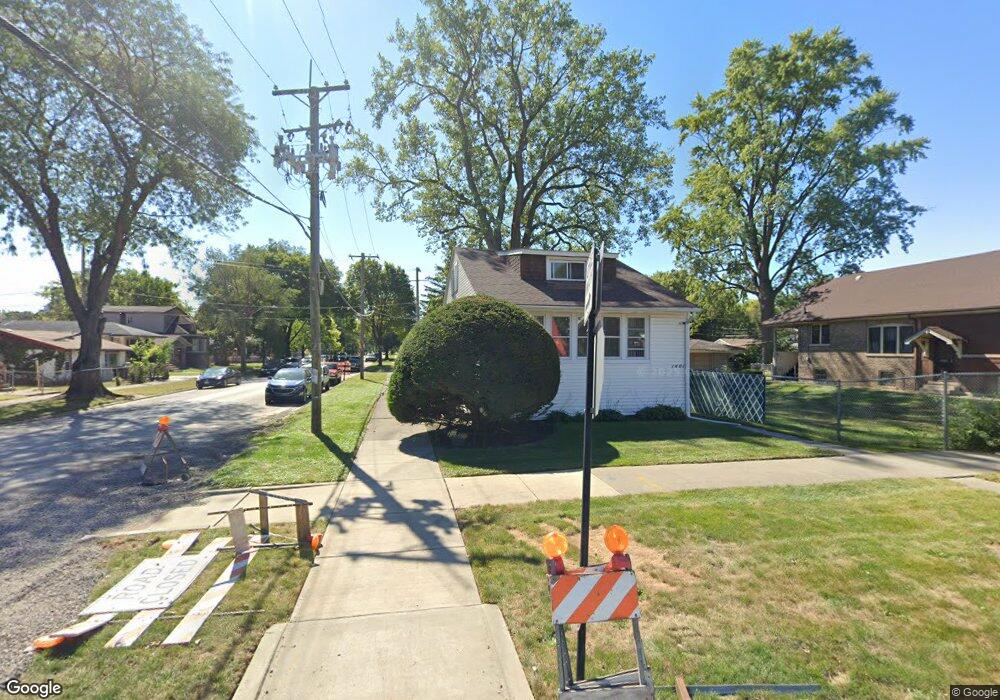
1401 W 112th Place Chicago, IL 60643
Morgan Park NeighborhoodEstimated Value: $122,000 - $207,655
3
Beds
1
Bath
1,152
Sq Ft
$145/Sq Ft
Est. Value
About This Home
This home is located at 1401 W 112th Place, Chicago, IL 60643 and is currently estimated at $167,164, approximately $145 per square foot. 1401 W 112th Place is a home located in Cook County with nearby schools including John D. Shoop Elementary School, Morgan Park High School, and Morgan Park Academy.
Ownership History
Date
Name
Owned For
Owner Type
Purchase Details
Closed on
Nov 30, 2001
Sold by
Grafft John C
Bought by
Marshall Percy D and Marshall Katina
Current Estimated Value
Home Financials for this Owner
Home Financials are based on the most recent Mortgage that was taken out on this home.
Original Mortgage
$86,700
Outstanding Balance
$33,954
Interest Rate
6.6%
Mortgage Type
VA
Estimated Equity
$133,210
Purchase Details
Closed on
Sep 7, 2001
Sold by
Skm Inc
Bought by
Grafft John C
Purchase Details
Closed on
Jun 28, 2001
Sold by
Capital Tax Corp
Bought by
Skm Inc
Purchase Details
Closed on
Jan 24, 2001
Sold by
The Bank Of New York
Bought by
Capital Tax Corp
Purchase Details
Closed on
May 30, 2000
Sold by
Jones Casey
Bought by
Amresco Residential Securities Corp
Purchase Details
Closed on
Apr 30, 1996
Sold by
Jones Casey
Bought by
Jones Casey
Home Financials for this Owner
Home Financials are based on the most recent Mortgage that was taken out on this home.
Original Mortgage
$16,000
Interest Rate
7.78%
Create a Home Valuation Report for This Property
The Home Valuation Report is an in-depth analysis detailing your home's value as well as a comparison with similar homes in the area
Home Values in the Area
Average Home Value in this Area
Purchase History
| Date | Buyer | Sale Price | Title Company |
|---|---|---|---|
| Marshall Percy D | $85,000 | Lawyers Title Insurance Corp | |
| Grafft John C | $45,000 | Lawyers Title Insurance Corp | |
| Skm Inc | $26,000 | -- | |
| Capital Tax Corp | $21,000 | -- | |
| Amresco Residential Securities Corp | -- | -- | |
| Jones Casey | -- | -- |
Source: Public Records
Mortgage History
| Date | Status | Borrower | Loan Amount |
|---|---|---|---|
| Open | Marshall Percy D | $86,700 | |
| Previous Owner | Jones Casey | $16,000 |
Source: Public Records
Tax History Compared to Growth
Tax History
| Year | Tax Paid | Tax Assessment Tax Assessment Total Assessment is a certain percentage of the fair market value that is determined by local assessors to be the total taxable value of land and additions on the property. | Land | Improvement |
|---|---|---|---|---|
| 2024 | -- | $9,200 | $3,465 | $5,735 |
| 2023 | -- | $5,500 | $2,904 | $2,596 |
| 2022 | $0 | $5,500 | $2,904 | $2,596 |
| 2021 | $509 | $5,500 | $2,904 | $2,596 |
| 2020 | $509 | $8,486 | $3,753 | $4,733 |
| 2019 | $497 | $9,326 | $3,753 | $5,573 |
| 2018 | $486 | $9,326 | $3,753 | $5,573 |
| 2017 | $667 | $10,643 | $3,465 | $7,178 |
| 2016 | $1,086 | $10,643 | $3,465 | $7,178 |
| 2015 | $1,044 | $10,643 | $3,465 | $7,178 |
| 2014 | $1,035 | $10,203 | $3,176 | $7,027 |
| 2013 | $1,038 | $10,203 | $3,176 | $7,027 |
Source: Public Records
Map
Nearby Homes
- 11345 S Ada St
- 1313 W 112th St
- 1450 W 114th Place
- 11425 S Elizabeth St
- 1309 W 110th Place
- 1237 W 110th Place
- 1416 W 110th Place
- 11531 S Throop St
- 1105 W 111th Place
- 11530 S Racine Ave
- 11367 S Aberdeen St
- 11604 S Elizabeth St
- 1721 W Steuben St
- 11625 S Laflin St
- 11518 S Aberdeen St
- 11635 S Ada St
- 1745 W Steuben St
- 11328 S Morgan St
- 11616 S Racine Ave
- 1115 W 110th St
- 1409 W 112th Place
- 1359 W 112th Place
- 1413 W 112th Place
- 11258 S Loomis St
- 1415 W 112th Place
- 1355 W 112th Place
- 1351 W 112th Place
- 1351 W 112th Place
- 1417 W 112th Place
- 11262 S Loomis St
- 11253 S Loomis St
- 11255 S Loomis St
- 1421 W 112th Place
- 11259 S Loomis St
- 11266 S Loomis St
- 1423 W 112th Place
- 11261 S Loomis St
- 1347 W 112th Place
- 11263 S Loomis St
- 1400 W 112th Place