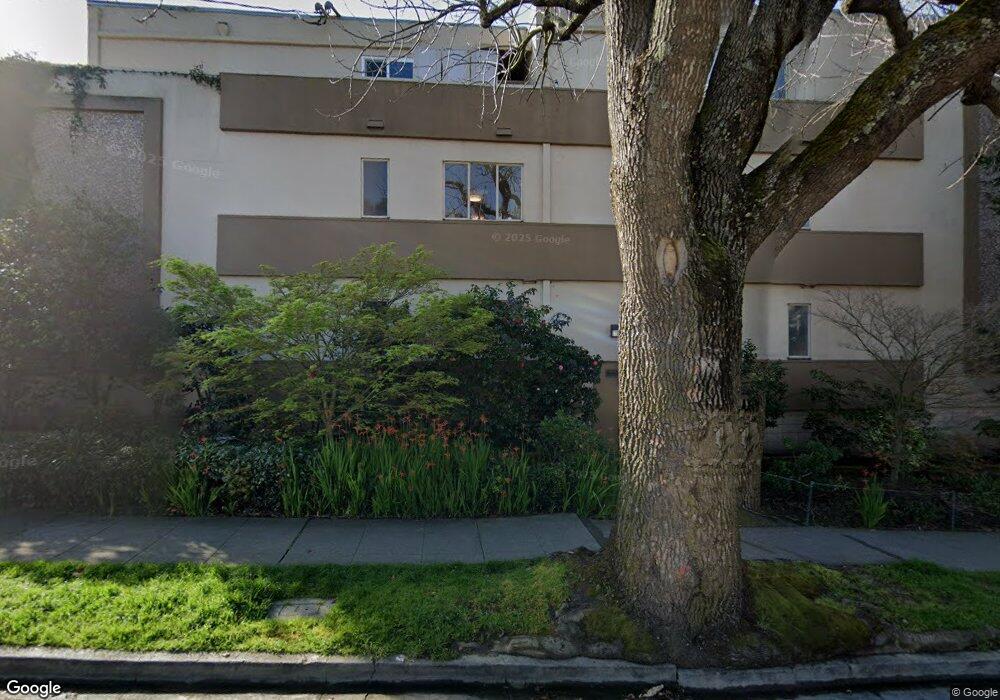
1401 Walnut St Unit 2C Berkeley, CA 94709
North Berkeley NeighborhoodEstimated Value: $953,189 - $1,528,000
2
Beds
2
Baths
1,666
Sq Ft
$744/Sq Ft
Est. Value
About This Home
This home is located at 1401 Walnut St Unit 2C, Berkeley, CA 94709 and is currently estimated at $1,239,297, approximately $743 per square foot. 1401 Walnut St Unit 2C is a home located in Alameda County with nearby schools including Berkeley Arts Magnet at Whittier School, Cragmont Elementary School, and Washington Elementary School.
Ownership History
Date
Name
Owned For
Owner Type
Purchase Details
Closed on
Aug 16, 2017
Sold by
Zwerdling Florence Elon
Bought by
Zwerdling Florence Elon
Current Estimated Value
Purchase Details
Closed on
Jan 26, 2017
Sold by
Zwerdling Alex and Zwerdling Florence Elon
Bought by
Zwerdling Alex and Zwerdling Florence Elon
Purchase Details
Closed on
Jan 4, 2011
Sold by
Marsh Patricia
Bought by
Zwerdling Alex and Zwerdling Florence Elon
Home Financials for this Owner
Home Financials are based on the most recent Mortgage that was taken out on this home.
Original Mortgage
$486,750
Outstanding Balance
$321,200
Interest Rate
4.12%
Mortgage Type
New Conventional
Estimated Equity
$918,097
Purchase Details
Closed on
Oct 26, 1999
Sold by
Dennis Jeanne S and Dennis Jeanne
Bought by
Dennis Jeanne S
Purchase Details
Closed on
Sep 16, 1999
Sold by
Naro Maryann
Bought by
Dennis Jeanne
Create a Home Valuation Report for This Property
The Home Valuation Report is an in-depth analysis detailing your home's value as well as a comparison with similar homes in the area
Home Values in the Area
Average Home Value in this Area
Purchase History
| Date | Buyer | Sale Price | Title Company |
|---|---|---|---|
| Zwerdling Florence Elon | -- | None Available | |
| Zwerdling Alex | -- | None Available | |
| Zwerdling Alex | $649,000 | Old Republic Title Company | |
| Dennis Jeanne S | -- | -- | |
| Dennis Jeanne | $407,000 | Chicago Title Co |
Source: Public Records
Mortgage History
| Date | Status | Borrower | Loan Amount |
|---|---|---|---|
| Open | Zwerdling Alex | $486,750 |
Source: Public Records
Tax History
| Year | Tax Paid | Tax Assessment Tax Assessment Total Assessment is a certain percentage of the fair market value that is determined by local assessors to be the total taxable value of land and additions on the property. | Land | Improvement |
|---|---|---|---|---|
| 2025 | $8,113 | $432,317 | $359,068 | $80,249 |
| 2024 | $8,113 | $423,705 | $352,029 | $78,676 |
| 2023 | $7,928 | $422,262 | $345,128 | $77,134 |
| 2022 | $7,749 | $406,984 | $338,362 | $75,622 |
| 2021 | $7,743 | $398,870 | $331,730 | $74,140 |
| 2020 | $7,239 | $401,710 | $328,330 | $73,380 |
| 2019 | $6,857 | $393,834 | $321,893 | $71,941 |
| 2018 | $6,720 | $386,115 | $315,584 | $70,531 |
| 2017 | $6,474 | $378,545 | $309,397 | $69,148 |
| 2016 | $6,199 | $371,125 | $303,332 | $67,793 |
| 2015 | $6,106 | $365,553 | $298,778 | $66,775 |
| 2014 | $6,038 | $358,395 | $292,928 | $65,467 |
Source: Public Records
Map
Nearby Homes
- 1444 Walnut St
- 1515 Oxford St Unit 1D
- 1408 Henry St
- 2121 Eunice St
- 1425 Martin Luther King jr Way
- 1682 Oxford St
- 1622 Scenic Ave
- 2315 Eunice St
- 2201 Virginia St Unit 2
- 1610 Milvia St
- 2501 Rose Walk
- 1609 Bonita Ave Unit 5
- 2421 Hilgard Ave
- 2340 Virginia St
- 1950 Hopkins St
- 1739 Spruce St
- 1625 Martin Luther King jr Way
- 2477 Virginia St
- 2451 Le Conte Ave
- 1808 Cedar St
- 1401 Walnut St Unit 1A
- 1401 Walnut St Unit 2B
- 1401 Walnut St Unit 3B
- 1401 Walnut St Unit 1A
- 1401 Walnut St Unit 2A
- 1401 Walnut St Unit 2D
- 1401 Walnut St
- 1401 Walnut St
- 1401 Walnut St
- 1401 Walnut St
- 1401 Walnut St
- 1401 Walnut St Unit 1C
- 1401 Walnut St
- 1411 Walnut St
- 1409 Walnut St
- 2136 Rose St
- 1419 Walnut St
- 1408 Oxford St
- 2129 Rose St
- 1404 Oxford St
Your Personal Tour Guide
Ask me questions while you tour the home.