Estimated Value: $6,544,094
--
Bed
--
Bath
28,977
Sq Ft
$226/Sq Ft
Est. Value
About This Home
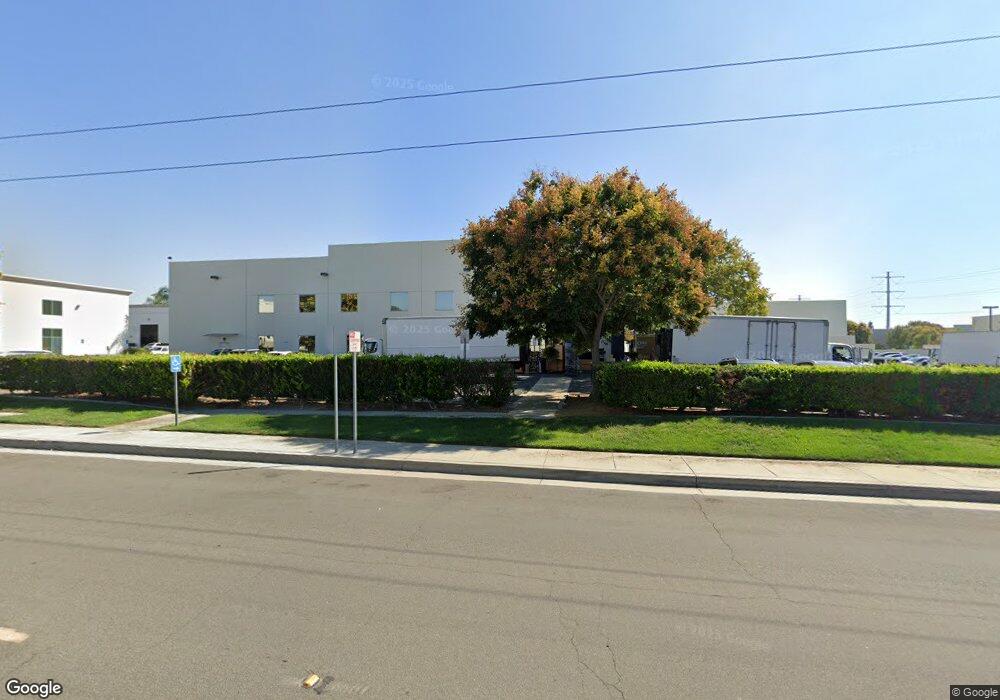
This home is located at 14011 12th St, Chino, CA 91710 and is currently estimated at $6,544,094, approximately $225 per square foot. 14011 12th St is a home located in San Bernardino County with nearby schools including Edwin Rhodes Elementary, Magnolia Junior High, and Chino High School.
Ownership History
Date
Name
Owned For
Owner Type
Purchase Details
Closed on
Aug 12, 2008
Sold by
Wong Ronald Man Gee and Wong Stella Suk Chun
Bought by
New Chino Llc
Current Estimated Value
Purchase Details
Closed on
Dec 21, 2005
Sold by
Pao Pao International Llc
Bought by
Wong Ronald and Wong Stella
Purchase Details
Closed on
Sep 24, 2004
Sold by
Industrial Real Estate Development Llc
Bought by
Pao Pao International Llc
Home Financials for this Owner
Home Financials are based on the most recent Mortgage that was taken out on this home.
Original Mortgage
$1,350,000
Interest Rate
5.76%
Mortgage Type
Commercial
Purchase Details
Closed on
Jan 8, 1998
Sold by
The Genlyte Group Inc
Bought by
The Genlyte Group Inc
Create a Home Valuation Report for This Property
The Home Valuation Report is an in-depth analysis detailing your home's value as well as a comparison with similar homes in the area
Home Values in the Area
Average Home Value in this Area
Purchase History
| Date | Buyer | Sale Price | Title Company |
|---|---|---|---|
| New Chino Llc | -- | None Available | |
| Wong Ronald Man Gee | -- | None Available | |
| Wong Ronald | $4,238,000 | Chicago Title Co | |
| Pao Pao International Llc | -- | North American Title Company | |
| The Genlyte Group Inc | -- | First American Title Co |
Source: Public Records
Mortgage History
| Date | Status | Borrower | Loan Amount |
|---|---|---|---|
| Previous Owner | Pao Pao International Llc | $1,350,000 | |
| Closed | Pao Pao International Llc | $500,000 |
Source: Public Records
Tax History Compared to Growth
Tax History
| Year | Tax Paid | Tax Assessment Tax Assessment Total Assessment is a certain percentage of the fair market value that is determined by local assessors to be the total taxable value of land and additions on the property. | Land | Improvement |
|---|---|---|---|---|
| 2025 | $60,324 | $5,582,984 | $1,191,441 | $4,391,543 |
| 2024 | $60,324 | $5,473,513 | $1,168,079 | $4,305,434 |
| 2023 | $58,649 | $5,366,189 | $1,145,175 | $4,221,014 |
| 2022 | $58,300 | $5,260,970 | $1,122,721 | $4,138,249 |
| 2021 | $57,167 | $5,157,814 | $1,100,707 | $4,057,107 |
| 2020 | $56,423 | $5,104,927 | $1,089,421 | $4,015,506 |
| 2019 | $55,432 | $5,004,831 | $1,068,060 | $3,936,771 |
| 2018 | $54,204 | $4,906,697 | $1,047,118 | $3,859,579 |
| 2017 | $48,772 | $4,406,600 | $1,175,100 | $3,231,500 |
| 2016 | $41,494 | $3,934,500 | $1,049,200 | $2,885,300 |
| 2015 | $38,580 | $3,677,100 | $980,600 | $2,696,500 |
| 2014 | $37,444 | $3,570,000 | $952,000 | $2,618,000 |
Source: Public Records
Map
Nearby Homes
- 6046 Lyon St
- 13536 Sycamore Ln
- 14212 Willamette Ave
- 6169 Winona St
- 6147 Davidson St
- 6162 Davidson St
- 6212 Athena St
- 13555 Magnolia Ave
- 14134 Mountain Ave
- 11610 Granville Place
- 4912 G St
- 14654 Willamette Ave
- 14738 Norfolk Ave
- 0 C St
- 13257 2nd St
- 13775 Harvard Ave
- 14349 Guilford Ave
- 14170 Durazno Ave
- 5962 C St
- 12951 Benson Ave Unit 118
- 5556 Edison Ave
- 5515 Daniels St
- 5595 Daniels St
- 5595 Daniels St
- 5595 Daniels St
- 5595 Daniels St Unit E
- 5595 Daniels St Unit B
- 5595 Daniels St Unit G
- 5595 Daniels St Unit D
- 5595 Daniels St Unit C
- 5595 Daniels St Unit A
- 5595 Daniels St Unit H
- 5595 Daniels St Unit F
- 5585 Daniels St
- 5585 Daniels St Unit C
- 5585 Daniels St Unit A/D
- 5581 Daniels St
- 5581 Daniels St Unit C
- 5581 Daniels St Unit J
- 5581 Daniels St Unit F