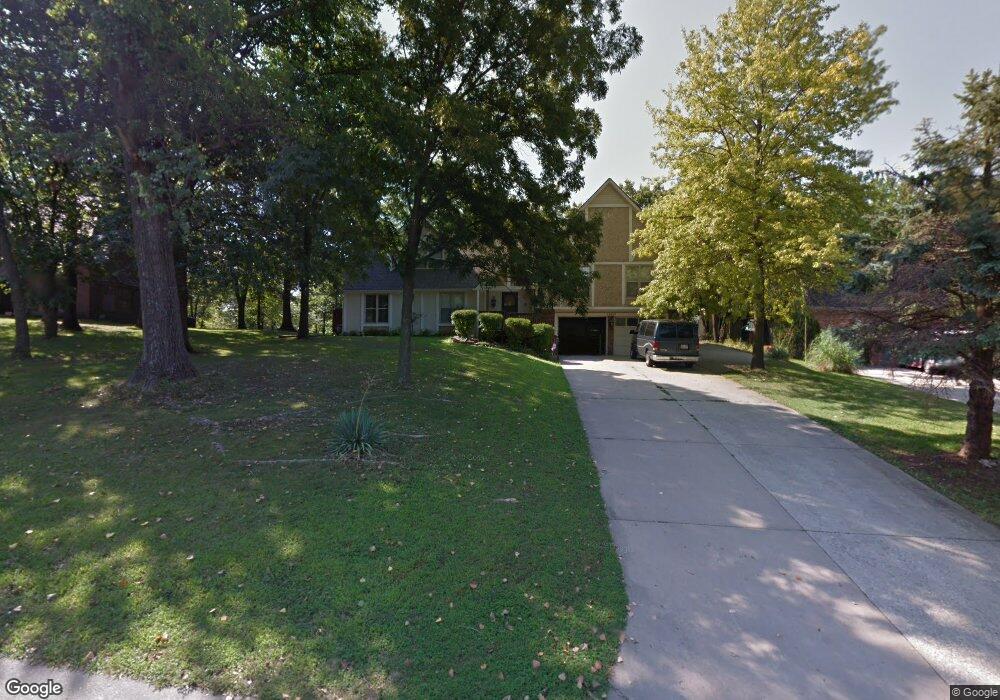
14013 W 47th Terrace Shawnee, KS 66216
Estimated Value: $464,119 - $503,000
4
Beds
4
Baths
2,399
Sq Ft
$202/Sq Ft
Est. Value
About This Home
This home is located at 14013 W 47th Terrace, Shawnee, KS 66216 and is currently estimated at $483,780, approximately $201 per square foot. 14013 W 47th Terrace is a home located in Johnson County with nearby schools including Ray Marsh Elementary School, Trailridge Middle School, and Shawnee Mission Northwest High School.
Ownership History
Date
Name
Owned For
Owner Type
Purchase Details
Closed on
Jan 13, 2021
Sold by
Dreiling Young Christine and Young Christine D
Bought by
Young Christine D
Current Estimated Value
Home Financials for this Owner
Home Financials are based on the most recent Mortgage that was taken out on this home.
Original Mortgage
$180,000
Outstanding Balance
$160,282
Interest Rate
2.71%
Mortgage Type
New Conventional
Estimated Equity
$323,498
Purchase Details
Closed on
Apr 26, 2006
Sold by
Brinkman Philip R and Brinkman Cynthia A
Bought by
Dreiling Young Christine
Home Financials for this Owner
Home Financials are based on the most recent Mortgage that was taken out on this home.
Original Mortgage
$21,300
Interest Rate
5.94%
Mortgage Type
Stand Alone Second
Create a Home Valuation Report for This Property
The Home Valuation Report is an in-depth analysis detailing your home's value as well as a comparison with similar homes in the area
Home Values in the Area
Average Home Value in this Area
Purchase History
| Date | Buyer | Sale Price | Title Company |
|---|---|---|---|
| Young Christine D | -- | None Available | |
| Dreiling Young Christine | -- | Assured Quality Title Co |
Source: Public Records
Mortgage History
| Date | Status | Borrower | Loan Amount |
|---|---|---|---|
| Open | Young Christine D | $180,000 | |
| Closed | Dreiling Young Christine | $21,300 | |
| Closed | Dreiling Young Christine | $170,400 |
Source: Public Records
Tax History Compared to Growth
Tax History
| Year | Tax Paid | Tax Assessment Tax Assessment Total Assessment is a certain percentage of the fair market value that is determined by local assessors to be the total taxable value of land and additions on the property. | Land | Improvement |
|---|---|---|---|---|
| 2024 | $5,739 | $42,332 | $7,643 | $34,689 |
| 2023 | $5,612 | $40,641 | $6,949 | $33,692 |
| 2022 | $5,099 | $35,742 | $6,325 | $29,417 |
| 2021 | $5,099 | $34,178 | $5,276 | $28,902 |
| 2020 | $4,887 | $31,280 | $5,276 | $26,004 |
| 2019 | $4,845 | $30,900 | $5,276 | $25,624 |
| 2018 | $4,605 | $28,715 | $5,276 | $23,439 |
| 2017 | $4,472 | $27,140 | $4,610 | $22,530 |
| 2016 | $4,310 | $25,415 | $4,610 | $20,805 |
| 2015 | $4,013 | $23,816 | $4,610 | $19,206 |
| 2013 | -- | $22,620 | $4,610 | $18,010 |
Source: Public Records
Map
Nearby Homes
- 14105 W 48th Terrace
- 14210 W 50th St
- 4940 Alden St
- 13810 W 53rd St
- 5013 Bradshaw St
- 5021 Bradshaw St
- 14170 W 49th St
- 5300 Summit Ct
- 13305 W 51st St
- 6804 Woodend Ave
- 13804 W 55th Terrace
- 5502 Mullen Rd
- 5530 Rene St
- 5507 Noland Rd
- 5633 Oakview St
- 12023 W 48th St
- 5703 Cottonwood St
- 5713 Widmer Rd
- 13130 W 52nd Terrace
- 13126 W 52nd Terrace
- 14009 W 47th Terrace
- 14015 W 47 Terrace
- 14015 W 47th Terrace
- 14012 W 48th St
- 14014 W 47th Terrace
- 14016 W 48th St
- 14008 W 48th St
- 14104 W 48th St
- 14008 W 47th Terrace
- 14004 W 48th St
- 13919 W 47th Terrace
- 14120 W 48th St
- 14115 W 47th Terrace
- 13918 W 47th Terrace
- 13920 W 48th St
- 7307 Oliver Cir
- 13901 W 47th Terrace
- 14112 W 47th Terrace
- 14013 W 48th St
- 7313 Oliver Cir