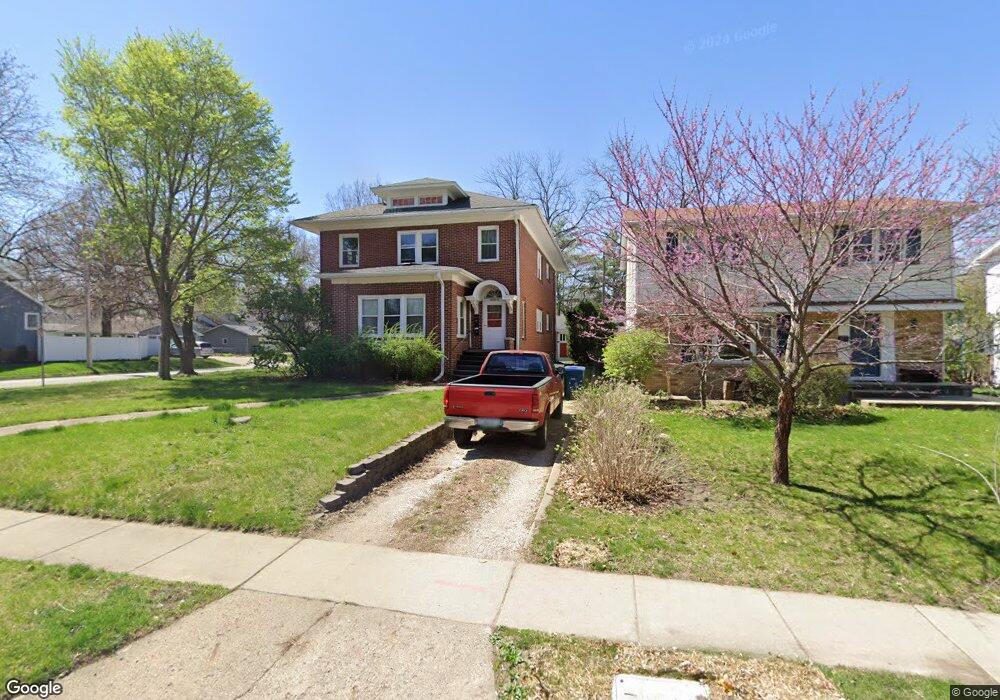
1402 44th St Des Moines, IA 50311
Waveland Park NeighborhoodEstimated Value: $265,000 - $322,244
4
Beds
2
Baths
2,730
Sq Ft
$108/Sq Ft
Est. Value
About This Home
This home is located at 1402 44th St, Des Moines, IA 50311 and is currently estimated at $293,622, approximately $107 per square foot. 1402 44th St is a home located in Polk County with nearby schools including Perkins Elementary School, Merrill Middle School, and Roosevelt High School.
Ownership History
Date
Name
Owned For
Owner Type
Purchase Details
Closed on
Feb 4, 2019
Sold by
Jacobs Louise M
Bought by
Evans Steven and Evans Rebecca
Current Estimated Value
Purchase Details
Closed on
Aug 29, 2015
Sold by
Jacobs Andrew D
Bought by
Jacobs Louise M
Purchase Details
Closed on
Dec 27, 2002
Sold by
Jacobs Andrew David and Jacobs Louise M
Bought by
Jacobs Andrew David and Jacobs Louise M
Purchase Details
Closed on
May 13, 1998
Sold by
Jacobs Andrew David and Jacobs Louise M
Bought by
Jacobs Andrew David and Jacobs Louise M
Create a Home Valuation Report for This Property
The Home Valuation Report is an in-depth analysis detailing your home's value as well as a comparison with similar homes in the area
Home Values in the Area
Average Home Value in this Area
Purchase History
| Date | Buyer | Sale Price | Title Company |
|---|---|---|---|
| Evans Steven | $205,000 | None Available | |
| Jacobs Louise M | $87,500 | Attorney | |
| Jacobs Andrew David | $41,000 | -- | |
| Jacobs Andrew David | -- | -- |
Source: Public Records
Tax History Compared to Growth
Tax History
| Year | Tax Paid | Tax Assessment Tax Assessment Total Assessment is a certain percentage of the fair market value that is determined by local assessors to be the total taxable value of land and additions on the property. | Land | Improvement |
|---|---|---|---|---|
| 2025 | $5,288 | $302,800 | $57,200 | $245,600 |
| 2024 | $5,288 | $268,800 | $50,700 | $218,100 |
| 2023 | $5,346 | $268,800 | $50,700 | $218,100 |
| 2022 | $5,304 | $226,800 | $44,800 | $182,000 |
| 2021 | $5,134 | $226,800 | $44,800 | $182,000 |
| 2020 | $5,332 | $205,700 | $40,900 | $164,800 |
| 2019 | $5,684 | $205,700 | $40,900 | $164,800 |
| 2018 | $5,626 | $211,500 | $35,800 | $175,700 |
| 2017 | $5,176 | $211,500 | $35,800 | $175,700 |
| 2016 | $5,044 | $191,400 | $32,100 | $159,300 |
| 2015 | $5,044 | $191,400 | $32,100 | $159,300 |
| 2014 | $4,634 | $174,400 | $28,700 | $145,700 |
Source: Public Records
Map
Nearby Homes
- 1347 44th St
- 1415 46th St
- 1314 44th St
- 1503 42nd St
- 1541 44th St
- 1310 47th St
- 1541 42nd St
- 1534 41st St
- 1529 41st St
- 1544 48th St
- 1716 47th St
- 3919 Maquoketa Dr
- 1333 39th St
- 1804 47th St
- 4902 University Ave Unit 335
- 1725 41st St
- 4000 University Ave Unit 7
- 1828 46th St
- 1659 Northwest Dr
- 3827 Carpenter Ave