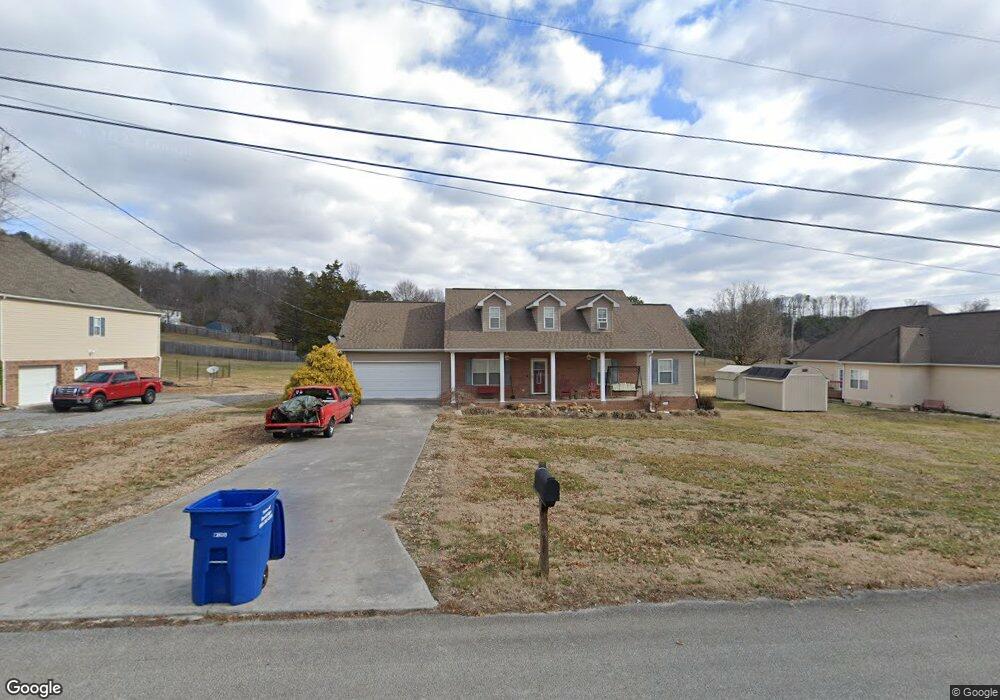
1402 Cedar Ln Dandridge, TN 37725
Estimated Value: $269,000 - $336,623
3
Beds
2
Baths
1,941
Sq Ft
$153/Sq Ft
Est. Value
About This Home
This home is located at 1402 Cedar Ln, Dandridge, TN 37725 and is currently estimated at $296,656, approximately $152 per square foot. 1402 Cedar Ln is a home located in Jefferson County with nearby schools including Mountain View Academy For Young Men.
Ownership History
Date
Name
Owned For
Owner Type
Purchase Details
Closed on
May 1, 2025
Sold by
Cline James G and Cline Lorna
Bought by
Omer Amanda
Current Estimated Value
Home Financials for this Owner
Home Financials are based on the most recent Mortgage that was taken out on this home.
Original Mortgage
$268,401
Outstanding Balance
$180,910
Interest Rate
6.67%
Mortgage Type
Construction
Estimated Equity
$115,746
Purchase Details
Closed on
Nov 14, 2011
Sold by
Edwards Helena M
Bought by
Cline James G and Cline Lorna
Home Financials for this Owner
Home Financials are based on the most recent Mortgage that was taken out on this home.
Original Mortgage
$132,000
Interest Rate
4.17%
Mortgage Type
Commercial
Purchase Details
Closed on
Dec 5, 2008
Sold by
Wachovia Mtg Corp
Bought by
Edwards Helena M
Purchase Details
Closed on
Jun 13, 2008
Bought by
Wachovia Mortgage Corp
Create a Home Valuation Report for This Property
The Home Valuation Report is an in-depth analysis detailing your home's value as well as a comparison with similar homes in the area
Home Values in the Area
Average Home Value in this Area
Purchase History
| Date | Buyer | Sale Price | Title Company |
|---|---|---|---|
| Omer Amanda | $265,000 | Tennessee Land Title | |
| Omer Amanda | $265,000 | Tennessee Land Title | |
| Cline James G | $165,000 | -- | |
| Edwards Helena M | $130,000 | -- | |
| Wachovia Mortgage Corp | $158,000 | -- |
Source: Public Records
Mortgage History
| Date | Status | Borrower | Loan Amount |
|---|---|---|---|
| Open | Omer Amanda | $268,401 | |
| Closed | Omer Amanda | $268,401 | |
| Previous Owner | Wachovia Mortgage Corp | $165,000 | |
| Previous Owner | Cline James G | $132,000 |
Source: Public Records
Tax History Compared to Growth
Tax History
| Year | Tax Paid | Tax Assessment Tax Assessment Total Assessment is a certain percentage of the fair market value that is determined by local assessors to be the total taxable value of land and additions on the property. | Land | Improvement |
|---|---|---|---|---|
| 2025 | $1,130 | $71,725 | $12,500 | $59,225 |
| 2023 | $1,130 | $35,250 | $0 | $0 |
| 2022 | $1,091 | $35,250 | $5,350 | $29,900 |
| 2021 | $1,091 | $35,250 | $5,350 | $29,900 |
| 2020 | $1,093 | $35,250 | $5,350 | $29,900 |
| 2019 | $1,094 | $35,250 | $5,350 | $29,900 |
| 2018 | $1,130 | $33,725 | $5,825 | $27,900 |
| 2017 | $1,130 | $33,725 | $5,825 | $27,900 |
| 2016 | $1,130 | $33,725 | $5,825 | $27,900 |
| 2015 | $1,129 | $33,725 | $5,825 | $27,900 |
| 2014 | $1,126 | $33,725 | $5,825 | $27,900 |
Source: Public Records
Map
Nearby Homes
- 1476 Martha Dandridge Cir
- 2041 Majestic Cir
- Lot 80 Serenity Overlook
- 0 Serenity Overlook
- 660 Armstrong Dr
- 118 Luxury Ln
- Lot 2 W Main St
- 626 Briarwood Dr
- Lot 99 Majestic Cir
- Lot 92R Majestic Cir
- 625 Armstrong Dr
- Lot 16 Woodland Way
- 171 W Meeting St
- 1130 Squirewood Way
- 115 Atalaya Dr
- Lot 13 Stokley Ct
- 0 Douglas Lake Island Unit 1306919
- Lot 68 Sunset Harbor Dr
- Lot 30 Emerald Isle Blvd
- 917 Crickett Dr