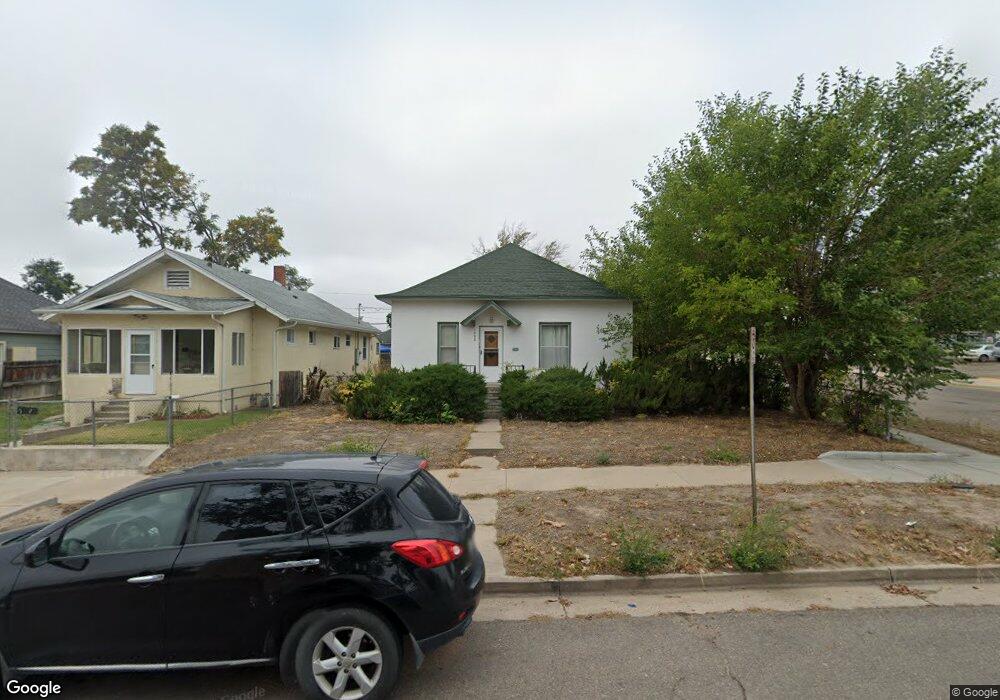
1402 E 6th St Pueblo, CO 81001
East Side NeighborhoodEstimated Value: $143,000 - $166,000
3
Beds
1
Bath
982
Sq Ft
$161/Sq Ft
Est. Value
About This Home
This home is located at 1402 E 6th St, Pueblo, CO 81001 and is currently estimated at $158,323, approximately $161 per square foot. 1402 E 6th St is a home located in Pueblo County with nearby schools including Park View Elementary School, Risley International Academy of Innovation, and East High School.
Ownership History
Date
Name
Owned For
Owner Type
Purchase Details
Closed on
May 10, 2019
Sold by
Pontius Daniel J and Pontius Sheila M
Bought by
Roybal Isidor Leo
Current Estimated Value
Home Financials for this Owner
Home Financials are based on the most recent Mortgage that was taken out on this home.
Original Mortgage
$45,590
Outstanding Balance
$39,919
Interest Rate
4%
Mortgage Type
New Conventional
Estimated Equity
$118,404
Purchase Details
Closed on
Oct 26, 2011
Sold by
Pontius Daniel J
Bought by
Pontius Daniel J and Pontius Shella
Purchase Details
Closed on
Oct 14, 2011
Sold by
Lucero Jose A and Pagano Sally J
Bought by
Pontius Daniel J
Purchase Details
Closed on
May 9, 2008
Sold by
Lucero Jose A
Bought by
Lucero Jose A and Pagano Sally J
Purchase Details
Closed on
Jul 9, 1975
Sold by
Lucero Jose A
Bought by
Lucero Jose A
Purchase Details
Closed on
Jul 7, 1967
Sold by
Means Kenneth V
Bought by
Lucero Jose A + Mary G
Create a Home Valuation Report for This Property
The Home Valuation Report is an in-depth analysis detailing your home's value as well as a comparison with similar homes in the area
Home Values in the Area
Average Home Value in this Area
Purchase History
| Date | Buyer | Sale Price | Title Company |
|---|---|---|---|
| Roybal Isidor Leo | $47,000 | Fidelity National Title | |
| Pontius Daniel J | -- | Springs Title Llc | |
| Pontius Daniel J | $37,000 | Springs Title Llc | |
| Lucero Jose A | -- | None Available | |
| Lucero Jose A | $7,000 | -- | |
| Lucero Jose A + Mary G | $115,500 | -- |
Source: Public Records
Mortgage History
| Date | Status | Borrower | Loan Amount |
|---|---|---|---|
| Open | Roybal Isidor Leo | $45,590 |
Source: Public Records
Tax History Compared to Growth
Tax History
| Year | Tax Paid | Tax Assessment Tax Assessment Total Assessment is a certain percentage of the fair market value that is determined by local assessors to be the total taxable value of land and additions on the property. | Land | Improvement |
|---|---|---|---|---|
| 2024 | $757 | $7,680 | -- | -- |
| 2023 | $766 | $11,370 | $1,010 | $10,360 |
| 2022 | $854 | $8,600 | $400 | $8,200 |
| 2021 | $1,252 | $8,850 | $410 | $8,440 |
| 2020 | $535 | $8,240 | $410 | $7,830 |
| 2019 | $475 | $4,706 | $286 | $4,420 |
| 2018 | $324 | $3,573 | $288 | $3,285 |
| 2017 | $327 | $3,573 | $288 | $3,285 |
| 2016 | $323 | $3,554 | $318 | $3,236 |
| 2015 | $322 | $3,554 | $318 | $3,236 |
| 2014 | $336 | $3,705 | $318 | $3,387 |
Source: Public Records
Map
Nearby Homes
- 1404 E 6th St
- 1406 E 6th St
- 1406 E 6th St Unit 1
- 1401 E 5th St
- 1408 E 6th St
- 1405 E 5th St
- 1409 E 5th St
- 1410 E 6th St
- 1413 E 5th St
- 1420 E 6th St
- 1415 E 5th St
- 1424 E 6th St
- 1421 E 5th St
- 1425 E 5th St
- 1426 E 6th St
- 1402 E 5th St
- 1404 E 5th St Unit 1406
- 1408 E 5th St
- 1427 E 5th St Unit 1429
- 1346 E 5th St