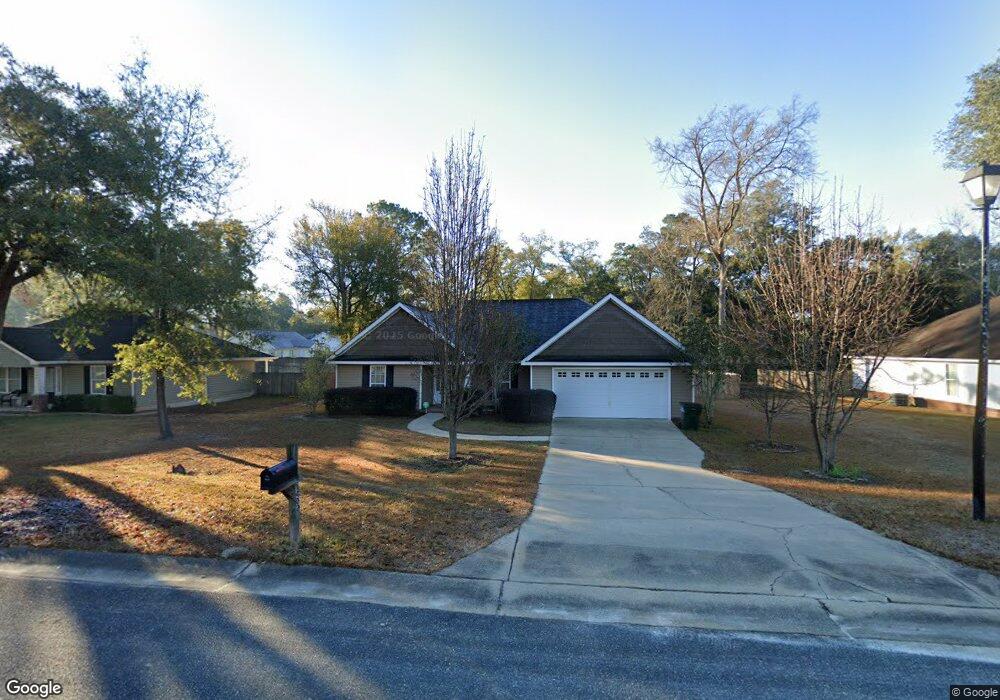
1402 Hemlock Dr Bainbridge, GA 39817
Estimated Value: $253,315 - $300,000
Studio
1
Bath
1,932
Sq Ft
$142/Sq Ft
Est. Value
About This Home
This home is located at 1402 Hemlock Dr, Bainbridge, GA 39817 and is currently estimated at $274,079, approximately $141 per square foot. 1402 Hemlock Dr is a home located in Decatur County with nearby schools including Bainbridge High School, Spring Creek Charter Academy, and Grace Christian Academy.
Ownership History
Date
Name
Owned For
Owner Type
Purchase Details
Closed on
Jan 7, 2008
Sold by
Chen Jun Ju
Bought by
Chen Jun Ju and Yang Hui Xiang
Current Estimated Value
Home Financials for this Owner
Home Financials are based on the most recent Mortgage that was taken out on this home.
Original Mortgage
$152,800
Interest Rate
5.68%
Mortgage Type
New Conventional
Purchase Details
Closed on
Dec 27, 2007
Sold by
Brock Construction & Rea
Bought by
Chen Jun Ju
Home Financials for this Owner
Home Financials are based on the most recent Mortgage that was taken out on this home.
Original Mortgage
$152,800
Interest Rate
5.68%
Mortgage Type
New Conventional
Purchase Details
Closed on
Dec 19, 2007
Sold by
Decatur County Development
Bought by
Brock Construction & Realty In
Home Financials for this Owner
Home Financials are based on the most recent Mortgage that was taken out on this home.
Original Mortgage
$152,800
Interest Rate
5.68%
Mortgage Type
New Conventional
Create a Home Valuation Report for This Property
The Home Valuation Report is an in-depth analysis detailing your home's value as well as a comparison with similar homes in the area
Purchase History
| Date | Buyer | Sale Price | Title Company |
|---|---|---|---|
| Chen Jun Ju | -- | -- | |
| Chen Jun Ju | $191,000 | -- | |
| Brock Construction & Realty In | $20,000 | -- |
Source: Public Records
Mortgage History
| Date | Status | Borrower | Loan Amount |
|---|---|---|---|
| Closed | Chen Jun Ju | $152,800 |
Source: Public Records
Tax History
| Year | Tax Paid | Tax Assessment Tax Assessment Total Assessment is a certain percentage of the fair market value that is determined by local assessors to be the total taxable value of land and additions on the property. | Land | Improvement |
|---|---|---|---|---|
| 2024 | $2,617 | $84,564 | $8,000 | $76,564 |
| 2023 | $2,123 | $84,564 | $8,000 | $76,564 |
| 2022 | $2,477 | $82,074 | $8,000 | $74,074 |
| 2021 | $2,344 | $75,776 | $8,000 | $67,776 |
| 2020 | $2,125 | $65,296 | $8,000 | $57,296 |
| 2019 | $2,094 | $62,020 | $8,000 | $54,020 |
| 2018 | $2,070 | $62,020 | $8,000 | $54,020 |
| 2017 | $2,178 | $62,288 | $8,000 | $54,288 |
| 2016 | $2,118 | $62,288 | $8,000 | $54,288 |
| 2015 | $2,179 | $62,288 | $8,000 | $54,288 |
| 2014 | $2,020 | $62,288 | $8,000 | $54,288 |
| 2013 | -- | $62,287 | $8,000 | $54,287 |
Source: Public Records
Map
Nearby Homes
- 1302 Majestic Ave
- 1002 Mildred St
- 1606 Hemlock St
- 000 E River Rd
- 1503 Smart St
- 1702 Vada Rd
- Lot 7 Easy Dr
- 2467 Belcher Ln
- 1204 E Water St
- 1307 E Broughton St
- 936 Cooper St
- 1203 E Broughton St
- 1020 E Water St
- 306 S Boulevard Dr
- 401 S Collier St
- 627 Planter St
- 411 Independent St
- 502 Chason St
- 502 Chason St
- 502 Planter St
- 1404 Hemlock Dr
- 1400 Hemlock Dr
- 1213 Majestic Ave
- 1300 Slash Ave
- 1301 Slash Ave
- 1301 Slash Ave Unit 1
- 1211 Majestic Ave
- 1301 Majestic Ave
- 1302 Slash Ave
- 1303 Slash Ave
- 1401 Hemlock Dr
- 1403 Hemlock Dr
- 1209 Majestic Ave
- 1405 Hemlock Dr
- 1303 Majestic Ave
- 1300 Majestic Ave
- 1220 Majestic Ave
- 1218 Majestic Ave
- 1207 Majestic Ave
- 1304 Slash Ave
Your Personal Tour Guide
Ask me questions while you tour the home.