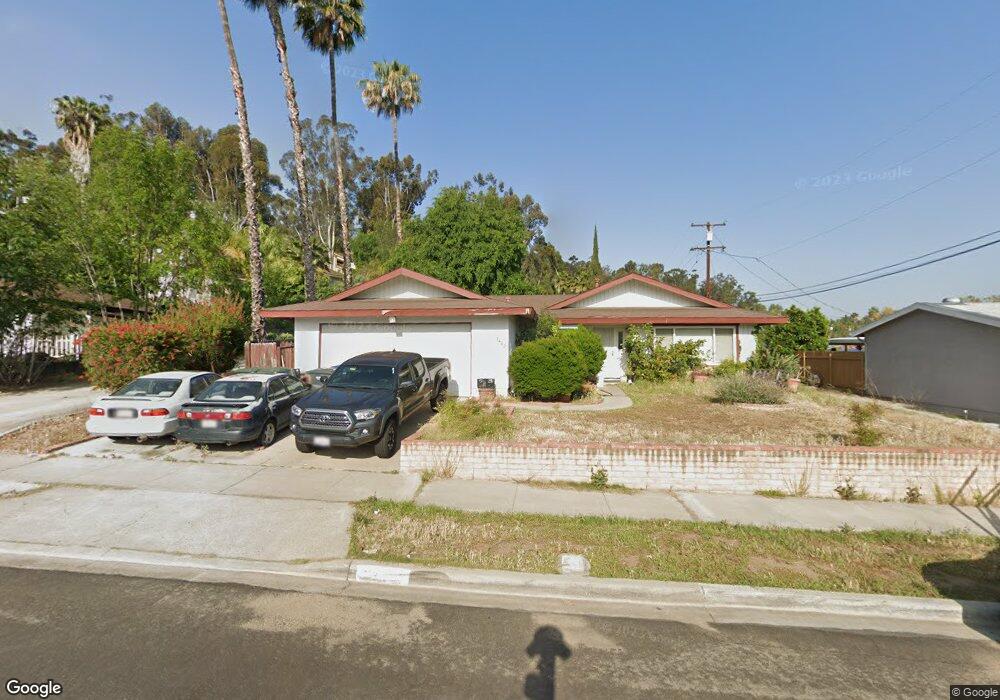
1402 Lemon Ave El Cajon, CA 92020
Estimated Value: $853,251 - $903,000
4
Beds
2
Baths
1,848
Sq Ft
$474/Sq Ft
Est. Value
About This Home
This home is located at 1402 Lemon Ave, El Cajon, CA 92020 and is currently estimated at $876,563, approximately $474 per square foot. 1402 Lemon Ave is a home located in San Diego County with nearby schools including Chase Avenue Elementary School, Cajon Valley Middle School, and Grossmont High School.
Ownership History
Date
Name
Owned For
Owner Type
Purchase Details
Closed on
Jun 13, 2006
Sold by
Liew Chee Sung
Bought by
Liew Chee Sung and Liew Chasity Ann
Current Estimated Value
Purchase Details
Closed on
Jul 19, 2002
Sold by
Bowerman M Alicia
Bought by
Liew Chee Sung
Home Financials for this Owner
Home Financials are based on the most recent Mortgage that was taken out on this home.
Original Mortgage
$279,900
Outstanding Balance
$113,676
Interest Rate
6.12%
Estimated Equity
$762,887
Purchase Details
Closed on
Jul 12, 2002
Sold by
Liew Chasity Ann
Bought by
Liew Chee Sung
Home Financials for this Owner
Home Financials are based on the most recent Mortgage that was taken out on this home.
Original Mortgage
$279,900
Outstanding Balance
$113,676
Interest Rate
6.12%
Estimated Equity
$762,887
Purchase Details
Closed on
Apr 12, 1994
Sold by
Bowerman Mary Alicia
Bought by
Bowerman M Alicia
Purchase Details
Closed on
Jun 16, 1992
Create a Home Valuation Report for This Property
The Home Valuation Report is an in-depth analysis detailing your home's value as well as a comparison with similar homes in the area
Purchase History
| Date | Buyer | Sale Price | Title Company |
|---|---|---|---|
| Liew Chee Sung | -- | None Available | |
| Liew Chee Sung | $350,000 | Commonwealth Land Title Co | |
| Liew Chee Sung | -- | Commonwealth Land Title Co | |
| Bowerman M Alicia | -- | -- | |
| -- | $173,000 | -- |
Source: Public Records
Mortgage History
| Date | Status | Borrower | Loan Amount |
|---|---|---|---|
| Open | Liew Chee Sung | $279,900 | |
| Closed | Liew Chee Sung | $34,900 |
Source: Public Records
Tax History
| Year | Tax Paid | Tax Assessment Tax Assessment Total Assessment is a certain percentage of the fair market value that is determined by local assessors to be the total taxable value of land and additions on the property. | Land | Improvement |
|---|---|---|---|---|
| 2025 | $6,411 | $506,751 | $217,240 | $289,511 |
| 2024 | $6,411 | $496,816 | $212,981 | $283,835 |
| 2023 | $6,373 | $487,075 | $208,805 | $278,270 |
| 2022 | $6,338 | $477,525 | $204,711 | $272,814 |
| 2021 | $6,309 | $468,163 | $200,698 | $267,465 |
| 2020 | $6,210 | $463,364 | $198,641 | $264,723 |
| 2019 | $5,683 | $454,280 | $194,747 | $259,533 |
| 2018 | $6,026 | $445,374 | $190,929 | $254,445 |
| 2017 | $5,775 | $436,642 | $187,186 | $249,456 |
| 2016 | $5,520 | $428,081 | $183,516 | $244,565 |
| 2015 | $4,945 | $400,000 | $171,000 | $229,000 |
| 2014 | $4,326 | $360,000 | $154,000 | $206,000 |
Source: Public Records
Map
Nearby Homes
- 1002 W Chase Ave
- 1043 Helix Village Dr
- 10595 Russell Rd
- 1440 S Orange Ave Unit 109
- 1440 S Orange Ave Unit 11
- 1440 S Orange Ave Unit 27
- 1440 S Orange Ave Unit 99
- 1440 S Orange Ave Unit 71
- 1440 S Orange Ave Unit 18
- 1440 S Orange Ave Unit 105
- 1440 S Orange Ave
- 1440 S Orange Ave Unit 92
- 1111 Boulevard Place
- 726 Paulsen Ave
- 1178 Eucalyptus Dr
- 1069 Estes St
- 1000 Estes St Unit 44
- 1000 Estes St Unit 35
- 1251 S Magnolia Ave
- 4742 Mount Helix Dr
Your Personal Tour Guide
Ask me questions while you tour the home.