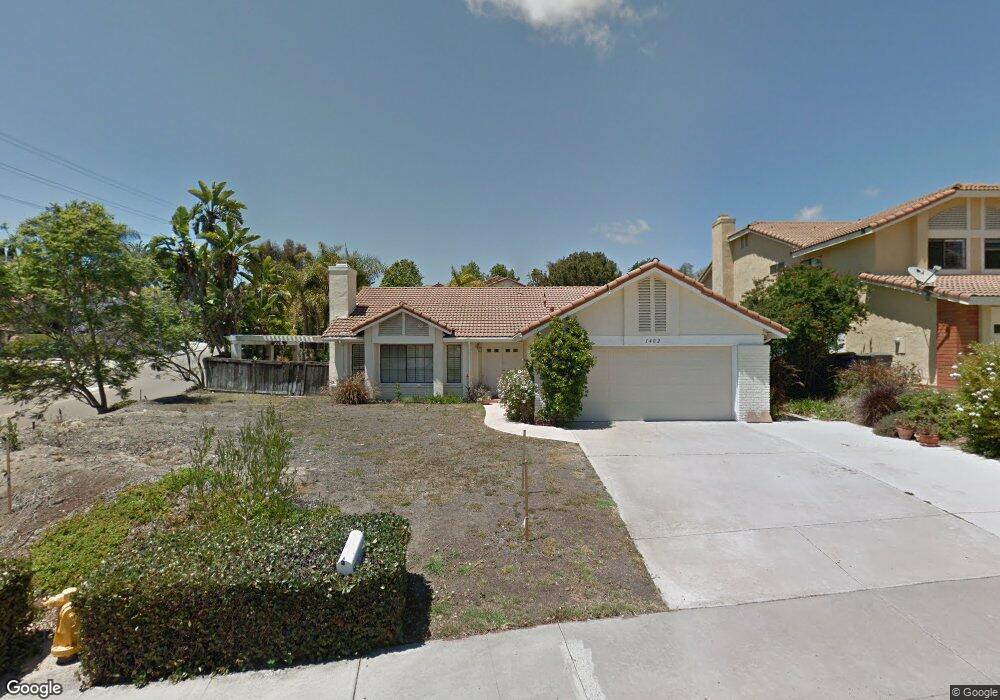
1402 Willowspring Dr N Encinitas, CA 92024
Central Encinitas NeighborhoodEstimated Value: $1,619,000 - $1,681,000
3
Beds
2
Baths
1,677
Sq Ft
$984/Sq Ft
Est. Value
About This Home
This home is located at 1402 Willowspring Dr N, Encinitas, CA 92024 and is currently estimated at $1,650,994, approximately $984 per square foot. 1402 Willowspring Dr N is a home located in San Diego County with nearby schools including Flora Vista Elementary, Diegueno Middle School, and La Costa Canyon High School.
Ownership History
Date
Name
Owned For
Owner Type
Purchase Details
Closed on
Oct 31, 2000
Sold by
Thomas James M and Thomas Joanne M
Bought by
Swanson Barbara A
Current Estimated Value
Home Financials for this Owner
Home Financials are based on the most recent Mortgage that was taken out on this home.
Original Mortgage
$252,000
Outstanding Balance
$92,724
Interest Rate
7.86%
Estimated Equity
$1,558,270
Purchase Details
Closed on
Jun 15, 1998
Sold by
Danmeier Jennifer E and Danmeier Caroline R
Bought by
Thomas James M and Thomas Joanne M
Home Financials for this Owner
Home Financials are based on the most recent Mortgage that was taken out on this home.
Original Mortgage
$224,000
Interest Rate
7.17%
Purchase Details
Closed on
Mar 1, 1988
Purchase Details
Closed on
Jun 19, 1987
Create a Home Valuation Report for This Property
The Home Valuation Report is an in-depth analysis detailing your home's value as well as a comparison with similar homes in the area
Home Values in the Area
Average Home Value in this Area
Purchase History
| Date | Buyer | Sale Price | Title Company |
|---|---|---|---|
| Swanson Barbara A | $370,000 | Fidelity National Title Co | |
| Thomas James M | $280,000 | Fidelity National Title | |
| -- | $199,000 | -- | |
| -- | $169,500 | -- |
Source: Public Records
Mortgage History
| Date | Status | Borrower | Loan Amount |
|---|---|---|---|
| Open | Swanson Barbara A | $252,000 | |
| Previous Owner | Thomas James M | $224,000 |
Source: Public Records
Tax History
| Year | Tax Paid | Tax Assessment Tax Assessment Total Assessment is a certain percentage of the fair market value that is determined by local assessors to be the total taxable value of land and additions on the property. | Land | Improvement |
|---|---|---|---|---|
| 2025 | $6,349 | $557,510 | $190,550 | $366,960 |
| 2024 | $6,349 | $546,579 | $186,814 | $359,765 |
| 2023 | $6,155 | $535,862 | $183,151 | $352,711 |
| 2022 | $5,999 | $525,356 | $179,560 | $345,796 |
| 2021 | $5,890 | $515,056 | $176,040 | $339,016 |
| 2020 | $5,787 | $509,775 | $174,235 | $335,540 |
| 2019 | $5,673 | $499,780 | $170,819 | $328,961 |
| 2018 | $5,579 | $489,981 | $167,470 | $322,511 |
| 2017 | $193 | $480,375 | $164,187 | $316,188 |
| 2016 | $5,318 | $470,957 | $160,968 | $309,989 |
| 2015 | $5,217 | $463,884 | $158,551 | $305,333 |
| 2014 | $5,090 | $454,798 | $155,446 | $299,352 |
Source: Public Records
Map
Nearby Homes
- 2072 Wandering Rd
- 1693 Honeysuckle Ct
- 1402 Village View Rd
- 1615 Orchard Wood Rd
- 1080 Primrose Ln
- 824 Glen Arbor Dr
- 1105 Catania Ct Unit 201
- 804 & 814 Clark Ave
- 3736 38 Via Rancho Michelle
- 200 202 Neptune Ave
- 772 Conestoga Ct
- 250 258 Hillcrest Dr
- 1733 Gentle Breeze Ln
- 1842 Avenida Mimosa
- 1825 Hummock Ln
- 1642 Blossom Field Way
- 2801 Jacaranda Ave
- 350 N El Camino Real Unit 78s
- 350 N El Camino Real Unit 72
- 1709 Edgefield Ln
- 1418 Willowspring Dr N
- 2190 Wandering Rd
- 702 Fieldstone Ln
- 2199 Wandering Rd
- 2191 Wandering Rd
- 2168 Wandering Rd
- 708 Fieldstone Ln
- 2169 Wandering Rd
- 1434 Willowspring Dr N
- 1082 Glen Arbor Dr
- 2146 Wandering Rd
- 714 Fieldstone Ln
- 731 Fieldstone Ln
- 1076 Glen Arbor Dr
- 2147 Wandering Rd
- 1450 Willowspring Dr N
- 2124 Wandering Rd
- 1769 Buttercup Rd
- 720 Fieldstone Ln
- 737 Fieldstone Ln
Your Personal Tour Guide
Ask me questions while you tour the home.