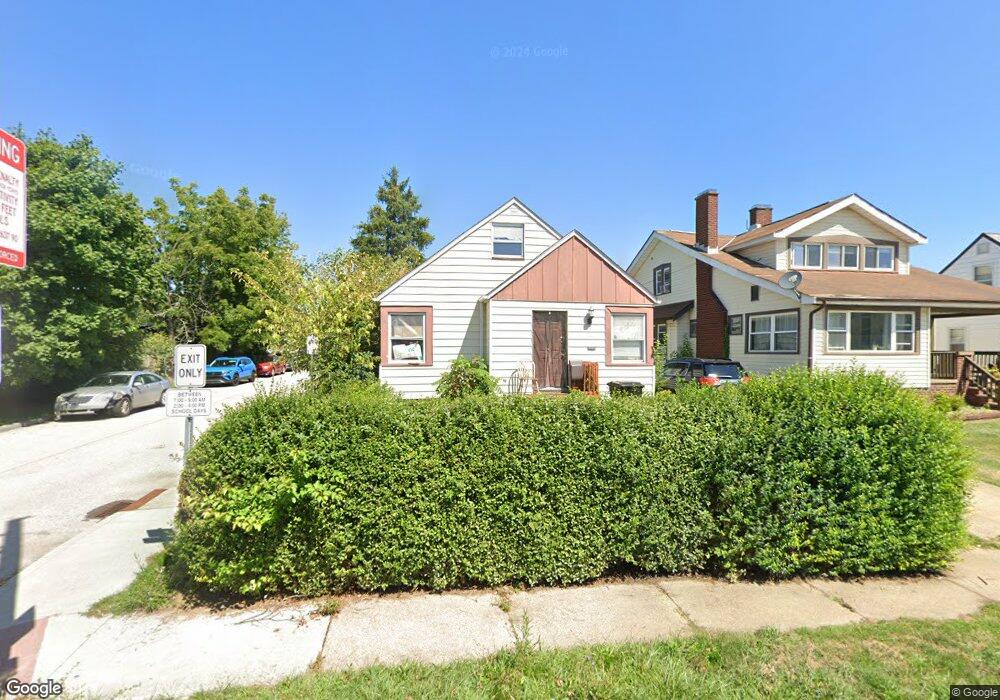
14022 Courtland Ave Cleveland, OH 44111
Jefferson NeighborhoodEstimated Value: $128,820 - $151,000
3
Beds
1
Bath
1,226
Sq Ft
$110/Sq Ft
Est. Value
About This Home
This home is located at 14022 Courtland Ave, Cleveland, OH 44111 and is currently estimated at $135,205, approximately $110 per square foot. 14022 Courtland Ave is a home located in Cuyahoga County with nearby schools including Artemus Ward School, Almira Academy, and Benjamin Franklin.
Ownership History
Date
Name
Owned For
Owner Type
Purchase Details
Closed on
Jul 17, 2024
Sold by
Schuller George P and Schuller Vicki L
Bought by
Quarles Derrick
Current Estimated Value
Purchase Details
Closed on
May 30, 2024
Sold by
Schuller Charles P
Bought by
Schuller George P
Purchase Details
Closed on
Jul 3, 2023
Sold by
Delosier Bonnie and Delosier Charles E
Bought by
Schuller George P
Purchase Details
Closed on
Jun 30, 2023
Sold by
Schuller Frederick M
Bought by
Schuller George P
Purchase Details
Closed on
Jun 15, 2023
Sold by
Kuchera John
Bought by
Schuller George P
Purchase Details
Closed on
Jan 17, 1989
Sold by
Mary Ann Schuller
Bought by
Schuller Mary Ann
Purchase Details
Closed on
Jul 25, 1979
Sold by
Schuller Mary Ann
Bought by
Mary Ann Schuller
Purchase Details
Closed on
Jan 1, 1975
Bought by
Schuller Mary Ann
Create a Home Valuation Report for This Property
The Home Valuation Report is an in-depth analysis detailing your home's value as well as a comparison with similar homes in the area
Home Values in the Area
Average Home Value in this Area
Purchase History
| Date | Buyer | Sale Price | Title Company |
|---|---|---|---|
| Quarles Derrick | $59,000 | None Listed On Document | |
| Schuller George P | -- | None Listed On Document | |
| Schuller George P | -- | None Listed On Document | |
| Schuller George P | -- | None Listed On Document | |
| Schuller George P | -- | None Listed On Document | |
| Schuller George P | -- | None Listed On Document | |
| Schuller George P | -- | None Listed On Document | |
| Schuller Mary Ann | -- | -- | |
| Mary Ann Schuller | -- | -- | |
| Schuller Mary Ann | -- | -- |
Source: Public Records
Tax History Compared to Growth
Tax History
| Year | Tax Paid | Tax Assessment Tax Assessment Total Assessment is a certain percentage of the fair market value that is determined by local assessors to be the total taxable value of land and additions on the property. | Land | Improvement |
|---|---|---|---|---|
| 2024 | $2,373 | $36,190 | $8,995 | $27,195 |
| 2023 | $1,567 | $20,660 | $6,340 | $14,320 |
| 2022 | $898 | $20,650 | $6,340 | $14,320 |
| 2021 | $889 | $20,650 | $6,340 | $14,320 |
| 2020 | $626 | $16,000 | $4,900 | $11,100 |
| 2019 | $579 | $45,700 | $14,000 | $31,700 |
| 2018 | $577 | $16,000 | $4,900 | $11,100 |
| 2017 | $430 | $13,970 | $3,890 | $10,080 |
| 2016 | $427 | $13,970 | $3,890 | $10,080 |
| 2015 | $1,844 | $13,970 | $3,890 | $10,080 |
| 2014 | $1,844 | $14,710 | $4,100 | $10,610 |
Source: Public Records
Map
Nearby Homes
- 13921 Wainstead Ave
- 13818 Courtland Ave
- 13810 Clifford Ave
- 13716 Tyler Ave
- 14212 Leroy Ave
- 4046 W 143rd St
- 3922 W 143rd St
- 14315 Viola Ave
- 14128 Lakota Ave
- 13910 Lyric Ave
- 13514 Tyler Ave
- 14513 Mission Rd
- 14434 Cleminshaw Rd
- 13904 Highlandview Ave
- 14319 Fairlawn Ave
- 3746 W 140th St
- 3918 Brookside Blvd
- 14014 Parkdale Ave
- 14018 Parkdale Ave
- 13301 Courtland Ave
- 14018 Courtland Ave
- 14018 Courtland Ave Unit UP
- 14014 Courtland Ave
- 14108 Courtland Ave
- 14112 Courtland Ave
- 3982 W 140th St
- 3978 W 140th St
- 3986 W 140th St
- 3974 W 140th St
- 14021 Courtland Ave
- 14101 Courtland Ave
- 14017 Courtland Ave
- 14116 Courtland Ave
- 14105 Courtland Ave
- 14013 Courtland Ave
- 14109 Courtland Ave
- 3994 W 140th St
- 14120 Courtland Ave
- 14113 Courtland Ave
- 3998 W 140th St