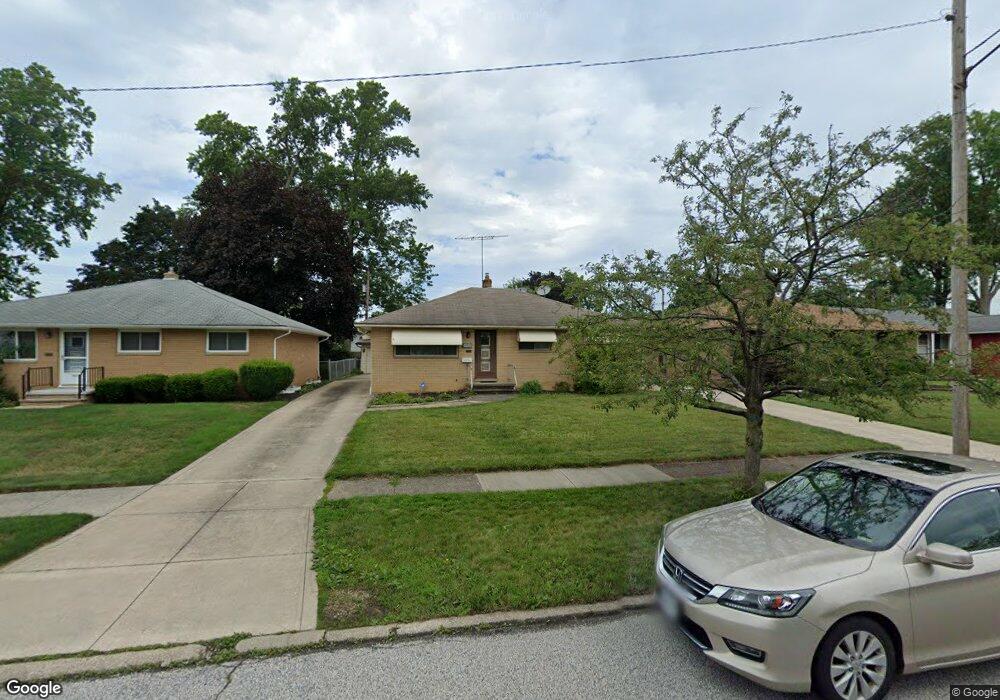
14022 Sheldon Rd Brookpark, OH 44142
Estimated Value: $233,921 - $261,000
3
Beds
3
Baths
1,140
Sq Ft
$213/Sq Ft
Est. Value
About This Home
This home is located at 14022 Sheldon Rd, Brookpark, OH 44142 and is currently estimated at $243,230, approximately $213 per square foot. 14022 Sheldon Rd is a home located in Cuyahoga County with nearby schools including Berea-Midpark Middle School, Berea-Midpark High School, and Huber Heights Preparatory Academy Parma Academy.
Ownership History
Date
Name
Owned For
Owner Type
Purchase Details
Closed on
Nov 14, 2023
Sold by
Tang Vi
Bought by
Tang Vi and Tang Loan
Current Estimated Value
Purchase Details
Closed on
Oct 26, 2000
Sold by
Wolf Norman R and Wolf Maxine D
Bought by
Tang Vi
Home Financials for this Owner
Home Financials are based on the most recent Mortgage that was taken out on this home.
Original Mortgage
$123,250
Interest Rate
10.45%
Purchase Details
Closed on
Sep 21, 1978
Sold by
Winter Maxine D
Bought by
Wolf Norman R
Purchase Details
Closed on
Aug 3, 1977
Sold by
Favorito Carmen
Bought by
Winter Maxine D
Purchase Details
Closed on
Oct 27, 1975
Sold by
Fauorito Carmel P and Fauorito Doris K
Bought by
Favorito Carmen
Purchase Details
Closed on
Jan 1, 1975
Bought by
Fauorito Carmel P and Fauorito Doris K
Create a Home Valuation Report for This Property
The Home Valuation Report is an in-depth analysis detailing your home's value as well as a comparison with similar homes in the area
Home Values in the Area
Average Home Value in this Area
Purchase History
| Date | Buyer | Sale Price | Title Company |
|---|---|---|---|
| Tang Vi | -- | None Listed On Document | |
| Tang Vi | $145,000 | Midland Title Security Inc | |
| Wolf Norman R | -- | -- | |
| Winter Maxine D | -- | -- | |
| Favorito Carmen | -- | -- | |
| Fauorito Carmel P | -- | -- |
Source: Public Records
Mortgage History
| Date | Status | Borrower | Loan Amount |
|---|---|---|---|
| Previous Owner | Tang Vi | $123,250 |
Source: Public Records
Tax History Compared to Growth
Tax History
| Year | Tax Paid | Tax Assessment Tax Assessment Total Assessment is a certain percentage of the fair market value that is determined by local assessors to be the total taxable value of land and additions on the property. | Land | Improvement |
|---|---|---|---|---|
| 2024 | $4,452 | $75,075 | $12,810 | $62,265 |
| 2023 | $3,590 | $58,940 | $9,730 | $49,210 |
| 2022 | $3,565 | $58,940 | $9,730 | $49,210 |
| 2021 | $3,544 | $58,940 | $9,730 | $49,210 |
| 2020 | $3,197 | $46,800 | $7,740 | $39,060 |
| 2019 | $3,102 | $133,700 | $22,100 | $111,600 |
| 2018 | $3,088 | $46,800 | $7,740 | $39,060 |
| 2017 | $3,097 | $43,340 | $7,810 | $35,530 |
| 2016 | $3,071 | $43,340 | $7,810 | $35,530 |
| 2015 | $2,745 | $43,340 | $7,810 | $35,530 |
| 2014 | $2,745 | $41,270 | $7,420 | $33,850 |
Source: Public Records
Map
Nearby Homes
- 13765 Newton Rd
- 13879 Zaremba Dr
- 13971 Park Dr
- 14340 Kingman Dr
- 13689 Pineview Ct
- 13493 Pineview Ct
- 14237 Starlite Dr
- 6771 Wood Creek Dr
- 14055 Donald Dr
- 6749 Middlebrook Blvd
- 6406 Fernhurst Ave
- 14890 Holland Rd
- 15446 Sheldon Rd
- 6378 Edgehurst Dr
- 6195 Hardin Dr
- 6943 N Parkway Dr Unit H6943
- 6363 Lockhaven Dr
- 6274 Anita Dr
- V/L Franke Rd
- 6470 Sandfield Dr
- 14002 Sheldon Rd
- 14042 Sheldon Rd
- 14060 Sheldon Rd
- 13982 Sheldon Rd
- 14099 Kathleen Dr
- 14081 Kathleen Dr
- 14117 Kathleen Dr
- 13962 Sheldon Rd
- 14133 Kathleen Dr
- 14063 Kathleen Dr
- 6455 Elmdale Rd
- 6459 Elmdale Rd
- 14055 Kathleen Dr
- 6451 Elmdale Rd
- 13942 Sheldon Rd
- 14031 Sheldon Rd
- 14003 Sheldon Rd
- 14063 Sheldon Rd
- 6435 Elmdale Rd
- 13975 Sheldon Rd