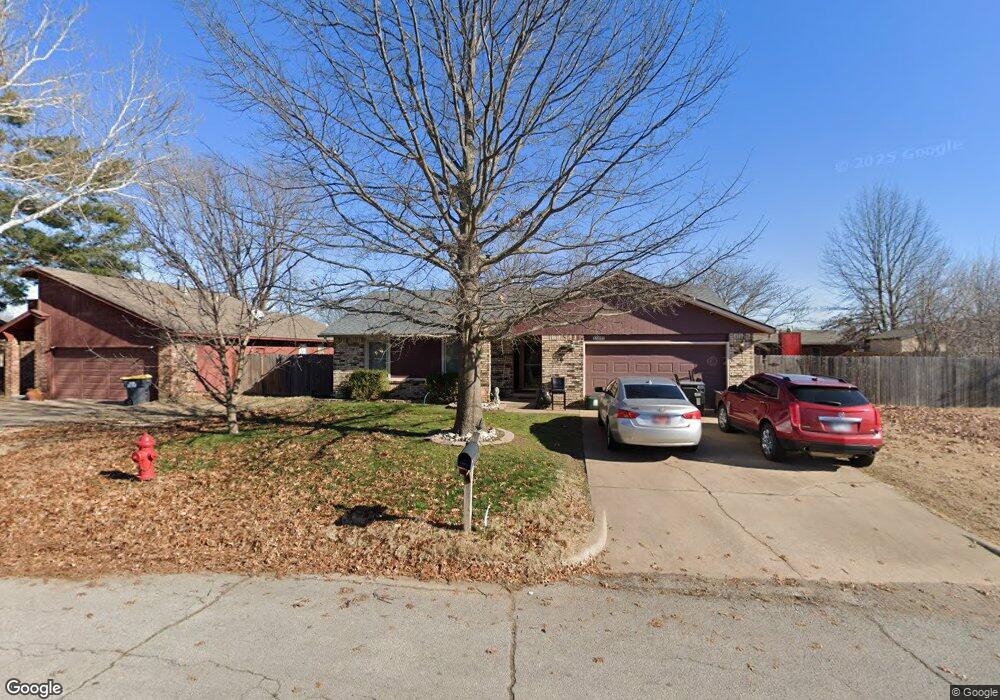
14023 S Poplar St Glenpool, OK 74033
Estimated Value: $202,251 - $211,000
3
Beds
2
Baths
1,205
Sq Ft
$172/Sq Ft
Est. Value
About This Home
This home is located at 14023 S Poplar St, Glenpool, OK 74033 and is currently estimated at $207,063, approximately $171 per square foot. 14023 S Poplar St is a home located in Tulsa County with nearby schools including Glenpool Elementary School, Glenpool Middle School, and Glenpool High School.
Ownership History
Date
Name
Owned For
Owner Type
Purchase Details
Closed on
Aug 8, 2018
Sold by
Life Tree Ventures Llc
Bought by
Martinez Aj Daniel
Current Estimated Value
Home Financials for this Owner
Home Financials are based on the most recent Mortgage that was taken out on this home.
Original Mortgage
$128,823
Outstanding Balance
$113,220
Interest Rate
5.25%
Mortgage Type
FHA
Estimated Equity
$93,843
Purchase Details
Closed on
Oct 31, 2014
Sold by
Zigler Levi D and Zigler Laura Lee
Bought by
Haver James M C and Haver Olga
Home Financials for this Owner
Home Financials are based on the most recent Mortgage that was taken out on this home.
Original Mortgage
$80,000
Interest Rate
4.23%
Mortgage Type
Purchase Money Mortgage
Purchase Details
Closed on
Sep 1, 1988
Create a Home Valuation Report for This Property
The Home Valuation Report is an in-depth analysis detailing your home's value as well as a comparison with similar homes in the area
Home Values in the Area
Average Home Value in this Area
Purchase History
| Date | Buyer | Sale Price | Title Company |
|---|---|---|---|
| Martinez Aj Daniel | $131,500 | First American Title | |
| Haver James M C | $100,000 | Tulsa Abstract & Title Co | |
| -- | $60,000 | -- |
Source: Public Records
Mortgage History
| Date | Status | Borrower | Loan Amount |
|---|---|---|---|
| Open | Martinez Aj Daniel | $128,823 | |
| Previous Owner | Haver James M C | $80,000 |
Source: Public Records
Tax History Compared to Growth
Tax History
| Year | Tax Paid | Tax Assessment Tax Assessment Total Assessment is a certain percentage of the fair market value that is determined by local assessors to be the total taxable value of land and additions on the property. | Land | Improvement |
|---|---|---|---|---|
| 2024 | $1,867 | $16,745 | $2,170 | $14,575 |
| 2023 | $1,867 | $15,948 | $2,203 | $13,745 |
| 2022 | $1,750 | $15,188 | $2,356 | $12,832 |
| 2021 | $1,693 | $14,465 | $2,244 | $12,221 |
| 2020 | $1,705 | $14,465 | $2,244 | $12,221 |
| 2019 | $1,717 | $14,465 | $2,244 | $12,221 |
| 2018 | $1,300 | $11,000 | $2,244 | $8,756 |
| 2017 | $1,272 | $11,000 | $2,244 | $8,756 |
| 2016 | $1,285 | $11,000 | $2,244 | $8,756 |
| 2015 | $1,278 | $11,000 | $2,244 | $8,756 |
| 2014 | $1,236 | $11,583 | $2,244 | $9,339 |
Source: Public Records
Map
Nearby Homes
- 13959 S Poplar St
- 14969 S Poplar Place
- 15025 S Oak St
- 15013 S Oak St
- 1286 E 140th Place
- 1323 E 143rd St
- 1289 E 139th St
- 1355 E 138th Place
- 1358 E 138th St
- 13857 S Nyssa Ct
- 13821 S Nyssa Ct
- 14468 S Poplar St
- 13846 S Nyssa Place
- 13761 S Nyssa Ct
- 14447 S Oklahoma Blvd
- 243 E 141st St
- 13672 S Kenosha Ave
- 14529 S Nyssa Place
- 1057 E 144th St
- 1122 E 144th Place
- 14001 S Poplar St
- 14034 S Poplar Place
- 14056 S Poplar Place
- 14012 S Poplar Place
- 14067 S Poplar St
- 13993 S Poplar St
- 14026 S Poplar St
- 14058 S Poplar St
- 14068 S Poplar Place
- 14004 S Poplar St
- 13990 S Poplar Place
- 14060 S Poplar St
- 13992 S Poplar St
- 13985 S Poplar St
- 13988 S Poplar Place
- 13980 S Poplar St
- 14017 S Oak Place
- 14039 S Oak Place
- 13977 S Poplar St
- 14005 S Oak Place