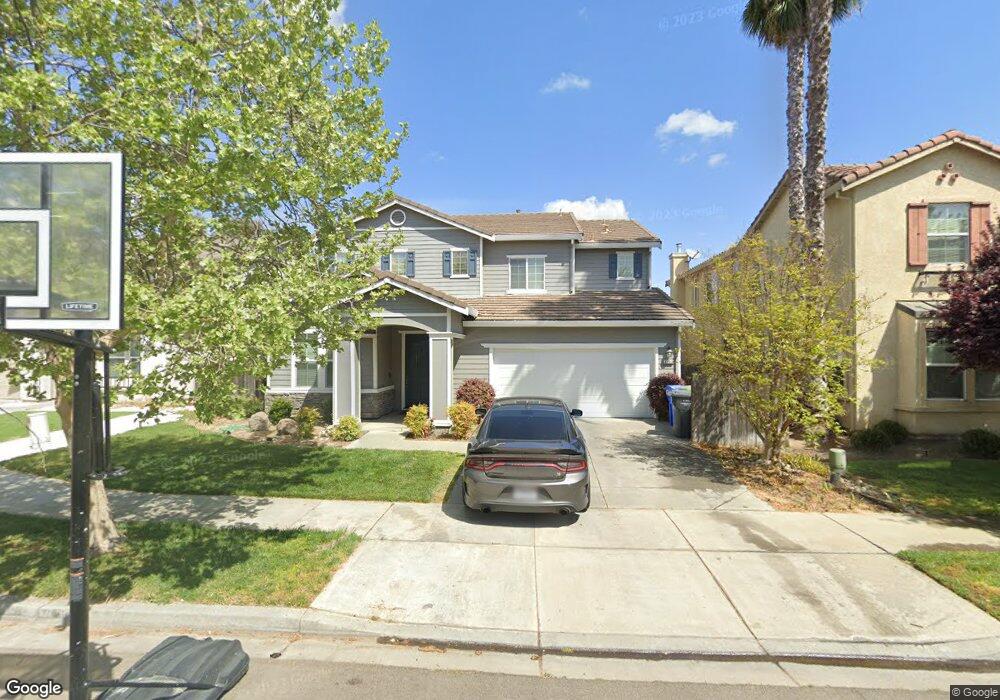
1403 Andleman Ct Turlock, CA 95382
Estimated Value: $509,000 - $627,000
4
Beds
3
Baths
2,265
Sq Ft
$251/Sq Ft
Est. Value
About This Home
This home is located at 1403 Andleman Ct, Turlock, CA 95382 and is currently estimated at $568,858, approximately $251 per square foot. 1403 Andleman Ct is a home located in Stanislaus County with nearby schools including Sandra Tovar Medeiros Elementary School, Turlock Junior High School, and Marvin A. Dutcher Middle School.
Ownership History
Date
Name
Owned For
Owner Type
Purchase Details
Closed on
Aug 6, 2008
Sold by
Us Bank Na
Bought by
Welch Dennis and Welch Elena
Current Estimated Value
Purchase Details
Closed on
Jul 6, 2007
Sold by
Ladine Matthew K
Bought by
U S Bank Na
Purchase Details
Closed on
Aug 30, 2005
Sold by
Ladine Matthew
Bought by
Ladine Matthew K and Ladine Kimberly J
Home Financials for this Owner
Home Financials are based on the most recent Mortgage that was taken out on this home.
Original Mortgage
$400,000
Interest Rate
6.45%
Mortgage Type
New Conventional
Purchase Details
Closed on
Jan 12, 2005
Sold by
Morrison Homes Inc
Bought by
Ladine Matthew and Ladine Kimberly
Home Financials for this Owner
Home Financials are based on the most recent Mortgage that was taken out on this home.
Original Mortgage
$306,481
Interest Rate
5.75%
Mortgage Type
Purchase Money Mortgage
Create a Home Valuation Report for This Property
The Home Valuation Report is an in-depth analysis detailing your home's value as well as a comparison with similar homes in the area
Home Values in the Area
Average Home Value in this Area
Purchase History
| Date | Buyer | Sale Price | Title Company |
|---|---|---|---|
| Welch Dennis | $241,500 | First American Title Company | |
| U S Bank Na | $369,000 | First American Title Co | |
| Ladine Matthew K | -- | Alliance Title Company | |
| Ladine Matthew | $383,500 | First American Title Co |
Source: Public Records
Mortgage History
| Date | Status | Borrower | Loan Amount |
|---|---|---|---|
| Previous Owner | Ladine Matthew K | $400,000 | |
| Previous Owner | Ladine Matthew | $306,481 | |
| Closed | Ladine Matthew | $76,620 |
Source: Public Records
Tax History Compared to Growth
Tax History
| Year | Tax Paid | Tax Assessment Tax Assessment Total Assessment is a certain percentage of the fair market value that is determined by local assessors to be the total taxable value of land and additions on the property. | Land | Improvement |
|---|---|---|---|---|
| 2024 | $4,164 | $304,883 | $82,056 | $222,827 |
| 2023 | $4,154 | $298,906 | $80,448 | $218,458 |
| 2022 | $4,099 | $293,046 | $78,871 | $214,175 |
| 2021 | $3,937 | $287,301 | $77,325 | $209,976 |
| 2020 | $3,896 | $284,356 | $76,533 | $207,823 |
| 2019 | $3,800 | $278,782 | $75,033 | $203,749 |
| 2018 | $3,795 | $273,316 | $73,562 | $199,754 |
| 2017 | $3,689 | $267,958 | $72,120 | $195,838 |
| 2016 | $3,485 | $262,705 | $70,706 | $191,999 |
| 2015 | $3,440 | $258,759 | $69,644 | $189,115 |
| 2014 | $3,397 | $253,691 | $68,280 | $185,411 |
Source: Public Records
Map
Nearby Homes
- 1360 Shady Ln Unit 1022
- 1360 Shady Ln Unit 522
- 1360 Shady Ln Unit 923
- 1815 Addison Dr
- 4305 Pastoral Ave
- 3884 Paula Ct
- 1173 Woodland Dr
- 4184 Horizon Ct
- 4320 Panorama Ave
- 1062 Ashford Dr
- 4591 Sandpiper Cir
- 3723 Honeycreeper Dr
- 3367 Four Seasons Dr
- 624 Summerton Ln
- 3403 Spring Crest Dr
- 5201 N Tully Rd
- 3300 Spring Garden Dr
- 715 W Taylor Rd
- 4162 Piccadilly Ln
- 494 Summerton Ln
- 1393 Andleman Ct
- 1413 Andleman Ct
- 1383 Andleman Ct
- 1423 Andleman Ct
- 4328 N Walnut Rd
- 1400 Andleman Ct
- 1373 Andleman Ct
- 1390 Andleman Ct
- 1410 Andleman Ct
- 1380 Andleman Ct
- 1420 Andleman Ct
- 1363 Andleman Ct
- 1370 Andleman Ct
- 1464 W Springer Dr
- 1360 Andleman Ct
- 1444 W Springer Dr
- 4173 Tahama Ln
- 1353 Andleman Ct
- 4183 Tahama Ln
- 1401 Shady Ln