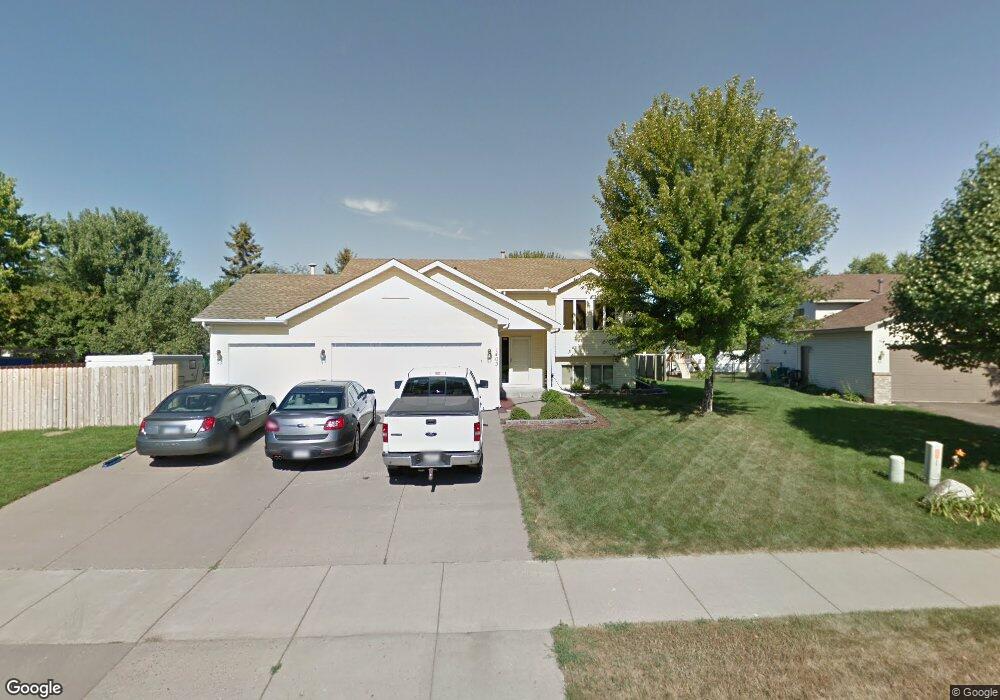
1403 Benson Blvd E Stillwater, MN 55082
Estimated Value: $448,000 - $470,000
4
Beds
3
Baths
1,164
Sq Ft
$394/Sq Ft
Est. Value
About This Home
This home is located at 1403 Benson Blvd E, Stillwater, MN 55082 and is currently estimated at $458,303, approximately $393 per square foot. 1403 Benson Blvd E is a home located in Washington County with nearby schools including Lily Lake Elementary School, Stillwater Middle School, and Stillwater Area High School.
Ownership History
Date
Name
Owned For
Owner Type
Purchase Details
Closed on
Sep 27, 2012
Sold by
Singer Michael A
Bought by
Singer Mitchell A
Current Estimated Value
Home Financials for this Owner
Home Financials are based on the most recent Mortgage that was taken out on this home.
Original Mortgage
$207,000
Outstanding Balance
$143,745
Interest Rate
3.57%
Mortgage Type
New Conventional
Estimated Equity
$314,558
Purchase Details
Closed on
Feb 21, 2008
Sold by
Federal Home Loan Mortgage Corporation
Bought by
Triad Guaranty Ins Corp
Purchase Details
Closed on
Aug 22, 2005
Sold by
King Sharon L
Bought by
Lienke Michael and Lienke Louisa
Purchase Details
Closed on
Aug 15, 2003
Sold by
Ritzer Kevin W and Ritzer Heather
Bought by
King Sharon Lee
Purchase Details
Closed on
Jun 1, 1998
Sold by
Church Of St Michael
Bought by
Ritzer Kevin W
Purchase Details
Closed on
Apr 30, 1997
Sold by
Knauff Louis I and Knauff Carolyn M
Bought by
Church Of St Michael
Create a Home Valuation Report for This Property
The Home Valuation Report is an in-depth analysis detailing your home's value as well as a comparison with similar homes in the area
Home Values in the Area
Average Home Value in this Area
Purchase History
| Date | Buyer | Sale Price | Title Company |
|---|---|---|---|
| Singer Mitchell A | $230,000 | Custom Home Builders Title | |
| Triad Guaranty Ins Corp | $262,846 | -- | |
| Lienke Michael | $299,000 | -- | |
| King Sharon Lee | $239,800 | -- | |
| Ritzer Kevin W | $164,000 | -- | |
| Church Of St Michael | $164,500 | -- |
Source: Public Records
Mortgage History
| Date | Status | Borrower | Loan Amount |
|---|---|---|---|
| Open | Singer Mitchell A | $207,000 |
Source: Public Records
Tax History Compared to Growth
Tax History
| Year | Tax Paid | Tax Assessment Tax Assessment Total Assessment is a certain percentage of the fair market value that is determined by local assessors to be the total taxable value of land and additions on the property. | Land | Improvement |
|---|---|---|---|---|
| 2024 | $5,242 | $442,400 | $170,000 | $272,400 |
| 2023 | $5,242 | $455,000 | $190,000 | $265,000 |
| 2022 | $3,970 | $385,300 | $144,500 | $240,800 |
| 2021 | $3,630 | $328,000 | $123,000 | $205,000 |
| 2020 | $3,726 | $310,000 | $110,000 | $200,000 |
| 2019 | $3,592 | $313,800 | $115,000 | $198,800 |
| 2018 | $3,358 | $288,500 | $110,000 | $178,500 |
| 2017 | $3,210 | $271,900 | $100,000 | $171,900 |
| 2016 | $3,228 | $250,800 | $80,000 | $170,800 |
| 2015 | $3,120 | $232,400 | $79,800 | $152,600 |
| 2013 | -- | $209,400 | $68,200 | $141,200 |
Source: Public Records
Map
Nearby Homes
- 1119 Gilbert Ct
- 828 Greeley St S
- XXX Industrial Blvd
- 2324 Driftwood Ln
- 211 Olive St W
- 721 Martha St S
- 609 Willard St W
- 212 Birchwood Dr N
- 418 Holcombe St S
- 2501 Hawthorne Ln
- 233 Sherburne St N
- 2840 Brewers Ln
- 1422 5th St S
- 5835 Oakgreen Ct N
- 1311 Meadowlark Dr
- 1112 4th St S
- 1104 4th St S
- 2866 Long Lake Dr
- 308 4th St S
- 5675 Oak Cove N
- 1403 1403 Benson-Boulevard-e
- 1419 Benson Blvd E
- 1217 Driving Park Rd
- 1209 Driving Park Rd
- 1201 Driving Park Rd
- 1225 Driving Park Rd
- 1420 Surrey Ln
- 1418 Benson Blvd E
- 1233 Driving Park Rd
- 1402 Benson Blvd E
- 1410 Surrey Ln
- 1398 Benson Blvd E
- 1450 Benson Blvd E
- 1450 1450 Benson-Boulevard-e
- 1451 Benson Blvd E
- 1241 Driving Park Rd
- 1390 Benson Blvd E
- 1371 Benson Blvd E
- 1400 Surrey Ln
- 1466 Benson Blvd E