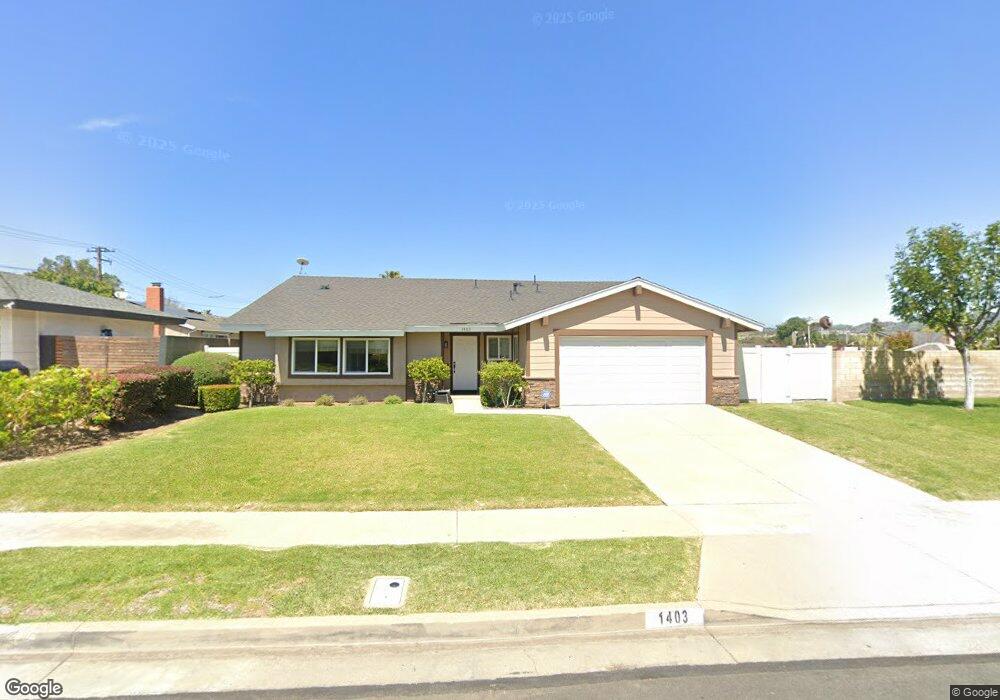
1403 Carlsbad St Placentia, CA 92870
Estimated Value: $1,077,000 - $1,220,000
3
Beds
2
Baths
1,950
Sq Ft
$589/Sq Ft
Est. Value
About This Home
This home is located at 1403 Carlsbad St, Placentia, CA 92870 and is currently estimated at $1,147,922, approximately $588 per square foot. 1403 Carlsbad St is a home located in Orange County with nearby schools including Van Buren Elementary School, Kraemer Middle School, and Valencia High School.
Ownership History
Date
Name
Owned For
Owner Type
Purchase Details
Closed on
Jun 23, 2005
Sold by
Tobias Sandra L
Bought by
Tobias Sandra L and The Trust Of Sandra L Tobias
Current Estimated Value
Purchase Details
Closed on
Sep 9, 2002
Sold by
Tobias Sandra L
Bought by
Tobias Sandra L and The Trust Of Sandra L Tobias
Home Financials for this Owner
Home Financials are based on the most recent Mortgage that was taken out on this home.
Original Mortgage
$150,000
Interest Rate
6.29%
Purchase Details
Closed on
Sep 4, 2002
Sold by
Tobias Sandra L and Anstey George N
Bought by
Anstey George N and Tobias Sandra L
Home Financials for this Owner
Home Financials are based on the most recent Mortgage that was taken out on this home.
Original Mortgage
$150,000
Interest Rate
6.29%
Purchase Details
Closed on
Nov 2, 1997
Sold by
Tobias Sandra L
Bought by
The Trust Of Sandra L Tobias
Create a Home Valuation Report for This Property
The Home Valuation Report is an in-depth analysis detailing your home's value as well as a comparison with similar homes in the area
Home Values in the Area
Average Home Value in this Area
Purchase History
| Date | Buyer | Sale Price | Title Company |
|---|---|---|---|
| Tobias Sandra L | -- | -- | |
| Tobias Sandra L | -- | -- | |
| Anstey George N | -- | Fidelity National Title | |
| Tobias Sandra L | -- | Fidelity National Title | |
| The Trust Of Sandra L Tobias | -- | -- |
Source: Public Records
Mortgage History
| Date | Status | Borrower | Loan Amount |
|---|---|---|---|
| Closed | Tobias Sandra L | $150,000 |
Source: Public Records
Tax History
| Year | Tax Paid | Tax Assessment Tax Assessment Total Assessment is a certain percentage of the fair market value that is determined by local assessors to be the total taxable value of land and additions on the property. | Land | Improvement |
|---|---|---|---|---|
| 2025 | $4,507 | $339,219 | $143,047 | $196,172 |
| 2024 | $4,507 | $332,568 | $140,242 | $192,326 |
| 2023 | $4,387 | $326,048 | $137,493 | $188,555 |
| 2022 | $4,290 | $319,655 | $134,797 | $184,858 |
| 2021 | $4,161 | $313,388 | $132,154 | $181,234 |
| 2020 | $4,057 | $310,175 | $130,799 | $179,376 |
| 2019 | $3,889 | $304,094 | $128,235 | $175,859 |
| 2018 | $3,836 | $298,132 | $125,721 | $172,411 |
| 2017 | $3,769 | $292,287 | $123,256 | $169,031 |
| 2016 | $3,694 | $286,556 | $120,839 | $165,717 |
| 2015 | $3,644 | $282,252 | $119,024 | $163,228 |
| 2014 | $3,544 | $276,724 | $116,693 | $160,031 |
Source: Public Records
Map
Nearby Homes
- 1248 Carlsbad St
- 1355 Montevideo Ave
- 5301 Raintree St
- 1509 Prospect Ave Unit D
- 642 Patten Ave
- 635 Patten Ave
- 623 Patten Ave
- 617 Patten Ave
- 1527 E Evans Ln
- 607 Patten Ave
- 17530 Monette Cir
- 605 Patten Ave
- 603 Patten Ave
- 581 Patten Ave
- 1000 Henrietta Cir
- 17271 Orange Dr
- 1261 Brian St
- 1270 E Providence Loop
- 1232 E Providence Loop
- 4662 Santa fe St
- 1208 N Jefferson St
- 1214 N Jefferson St
- 1406 Mesa Verde Cir
- 1415 Carlsbad St
- 1408 Carlsbad St
- 1402 Carlsbad St
- 1414 Carlsbad St
- 1220 N Jefferson St
- 1418 Mesa Verde Cir
- 1421 Carlsbad St
- 1205 N Jefferson St
- 1409 Mesa Verde Cir
- 1420 Carlsbad St
- 1211 N Jefferson St
- 1424 Mesa Verde Cir
- 17021 Cumberland Cir
- 17011 Cumberland Cir
- 1226 N Jefferson St
- 1356 Omaha Ave
- 1356 Vina Del Mar Ave
Your Personal Tour Guide
Ask me questions while you tour the home.