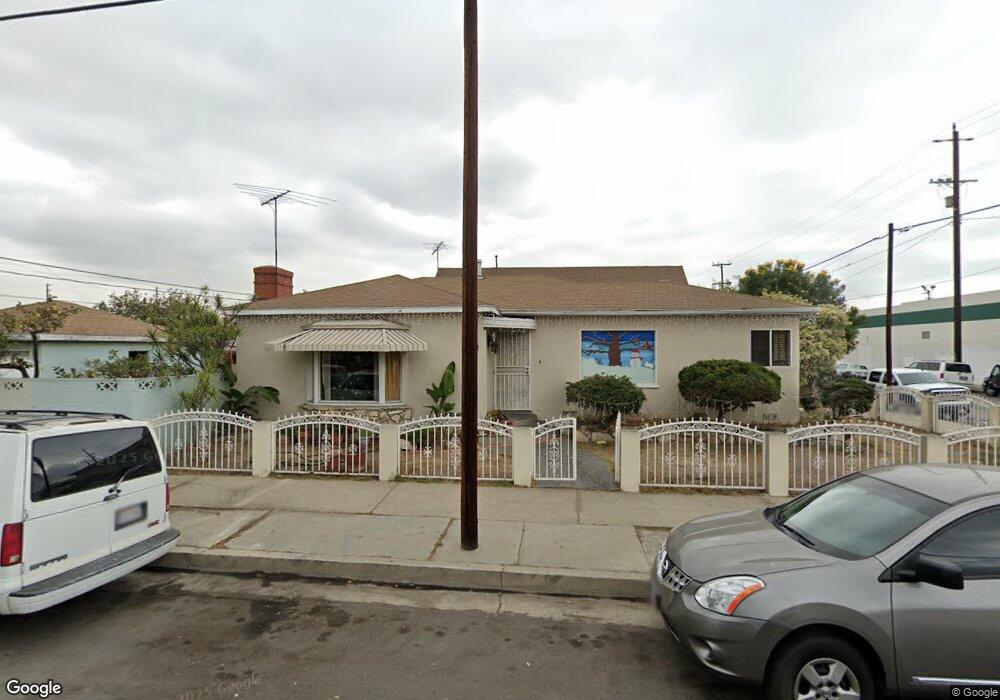
1403 E Opp St Wilmington, CA 90744
Estimated Value: $581,000 - $635,000
2
Beds
1
Bath
1,098
Sq Ft
$559/Sq Ft
Est. Value
About This Home
This home is located at 1403 E Opp St, Wilmington, CA 90744 and is currently estimated at $613,457, approximately $558 per square foot. 1403 E Opp St is a home located in Los Angeles County with nearby schools including Wilmington Park Elementary, Wilmington Middle School STEAM Magnet, and Phineas Banning Senior High School.
Ownership History
Date
Name
Owned For
Owner Type
Purchase Details
Closed on
Apr 3, 2017
Sold by
Tegel
Bought by
Tegel
Current Estimated Value
Home Financials for this Owner
Home Financials are based on the most recent Mortgage that was taken out on this home.
Interest Rate
4.14%
Purchase Details
Closed on
Dec 19, 2006
Sold by
Moreno Mario Garcia and Garcia Maria De Los Angeles
Bought by
Moreno Mario Garcia
Home Financials for this Owner
Home Financials are based on the most recent Mortgage that was taken out on this home.
Original Mortgage
$261,250
Interest Rate
6.22%
Mortgage Type
New Conventional
Purchase Details
Closed on
Nov 7, 1995
Sold by
Rodriguez Tomasita N
Bought by
Garcia Mario and Garcia Maria Delosangeles
Home Financials for this Owner
Home Financials are based on the most recent Mortgage that was taken out on this home.
Original Mortgage
$115,400
Interest Rate
7.58%
Create a Home Valuation Report for This Property
The Home Valuation Report is an in-depth analysis detailing your home's value as well as a comparison with similar homes in the area
Home Values in the Area
Average Home Value in this Area
Purchase History
| Date | Buyer | Sale Price | Title Company |
|---|---|---|---|
| Tegel | -- | -- | |
| Moreno Mario Garcia | -- | First American Title Company | |
| Garcia Mario | $119,000 | Fidelity National Title Ins |
Source: Public Records
Mortgage History
| Date | Status | Borrower | Loan Amount |
|---|---|---|---|
| Closed | Tegel | -- | |
| Previous Owner | Moreno Mario Garcia | $261,250 | |
| Previous Owner | Garcia Mario | $115,400 |
Source: Public Records
Tax History Compared to Growth
Tax History
| Year | Tax Paid | Tax Assessment Tax Assessment Total Assessment is a certain percentage of the fair market value that is determined by local assessors to be the total taxable value of land and additions on the property. | Land | Improvement |
|---|---|---|---|---|
| 2025 | $2,600 | $197,658 | $126,408 | $71,250 |
| 2024 | $2,600 | $193,783 | $123,930 | $69,853 |
| 2023 | $2,554 | $189,984 | $121,500 | $68,484 |
| 2022 | $2,441 | $186,260 | $119,118 | $67,142 |
| 2021 | $2,408 | $182,609 | $116,783 | $65,826 |
| 2019 | $2,340 | $177,195 | $113,320 | $63,875 |
| 2018 | $2,285 | $173,722 | $111,099 | $62,623 |
| 2016 | $2,178 | $166,979 | $106,786 | $60,193 |
| 2015 | $2,148 | $164,471 | $105,182 | $59,289 |
| 2014 | $2,163 | $161,250 | $103,122 | $58,128 |
Source: Public Records
Map
Nearby Homes
- 915 Flint Ave
- 900 E Denni St Unit 43
- 1125 Dominguez Ave
- 908 Mcfarland Ave
- 939 Vreeland Ave
- 1311 E Pacific Coast Hwy Unit 2
- 1437 E Colon St
- 1319 E Colon St
- 1119 E Colon St
- 914 E O St
- 1046 N Banning Blvd
- 235 E Anaheim St
- 1210 1212 E Cruces
- 1353 Lakme Ave
- 1526 Lakme Ave
- 323 Ross Place
- 1112 Island Ave
- 329 Ross Place
- 1610 Broad Ave
- 1043 Lagoon Ave