Estimated Value: $306,000 - $329,000
--
Bed
1
Bath
1,528
Sq Ft
$207/Sq Ft
Est. Value
About This Home
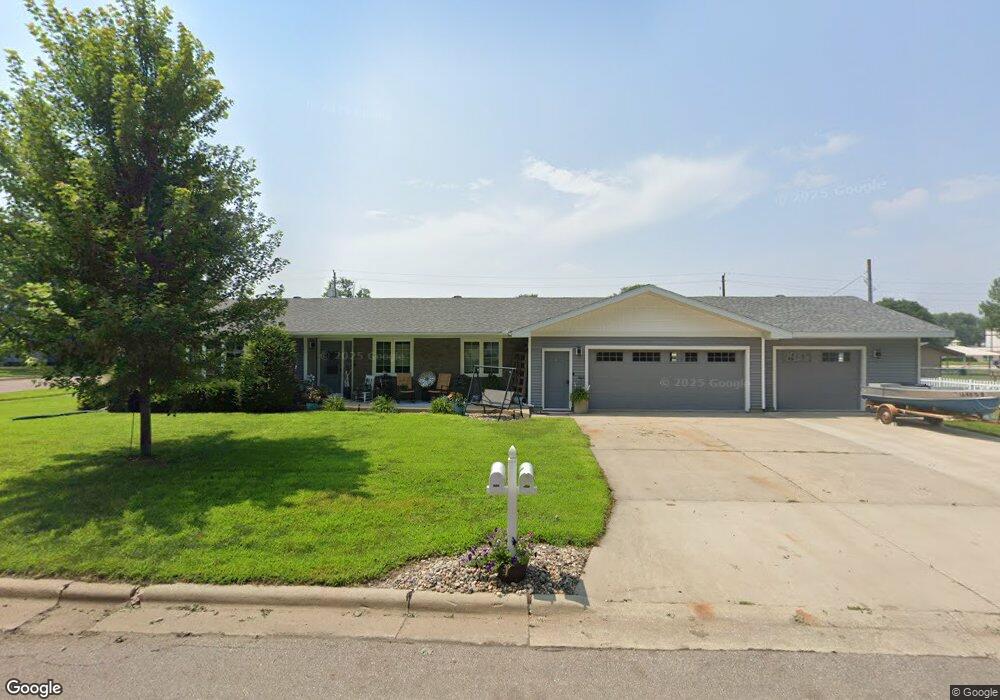
This home is located at 1403 Maple St, Hull, IA 51239 and is currently estimated at $317,056, approximately $207 per square foot. 1403 Maple St is a home located in Sioux County with nearby schools including Boyden-Hull Elementary School, Boyden-Hull High School, and Hull Christian School.
Ownership History
Date
Name
Owned For
Owner Type
Purchase Details
Closed on
Jul 15, 2015
Sold by
Pollema Waylon J and Pollema Melissa D
Bought by
Fisher Christiana M and Fisher Mandy L
Current Estimated Value
Home Financials for this Owner
Home Financials are based on the most recent Mortgage that was taken out on this home.
Original Mortgage
$142,800
Outstanding Balance
$111,966
Interest Rate
4.02%
Mortgage Type
New Conventional
Estimated Equity
$205,090
Purchase Details
Closed on
Jan 31, 2006
Sold by
Vanessen Matthew D and Van Essen Angela J
Bought by
Pollema Waylon J and Pollema Melissa D
Home Financials for this Owner
Home Financials are based on the most recent Mortgage that was taken out on this home.
Original Mortgage
$137,700
Interest Rate
6.37%
Mortgage Type
New Conventional
Create a Home Valuation Report for This Property
The Home Valuation Report is an in-depth analysis detailing your home's value as well as a comparison with similar homes in the area
Home Values in the Area
Average Home Value in this Area
Purchase History
| Date | Buyer | Sale Price | Title Company |
|---|---|---|---|
| Fisher Christiana M | $155,500 | None Available | |
| Pollema Waylon J | $142,000 | None Available |
Source: Public Records
Mortgage History
| Date | Status | Borrower | Loan Amount |
|---|---|---|---|
| Open | Fisher Christiana M | $142,800 | |
| Previous Owner | Pollema Waylon J | $137,700 |
Source: Public Records
Tax History Compared to Growth
Tax History
| Year | Tax Paid | Tax Assessment Tax Assessment Total Assessment is a certain percentage of the fair market value that is determined by local assessors to be the total taxable value of land and additions on the property. | Land | Improvement |
|---|---|---|---|---|
| 2025 | $3,996 | $324,850 | $26,640 | $298,210 |
| 2024 | $3,996 | $273,450 | $26,640 | $246,810 |
| 2023 | $3,936 | $273,450 | $26,640 | $246,810 |
| 2022 | $3,236 | $195,590 | $26,640 | $168,950 |
| 2021 | $3,080 | $196,370 | $26,640 | $169,730 |
| 2020 | $3,080 | $178,180 | $26,640 | $151,540 |
| 2019 | $2,896 | $165,910 | $13,880 | $152,030 |
| 2018 | $2,952 | $165,910 | $13,880 | $152,030 |
| 2017 | $2,952 | $165,910 | $13,880 | $152,030 |
| 2014 | $2,348 | $138,350 | $0 | $0 |
Source: Public Records
Map
Nearby Homes