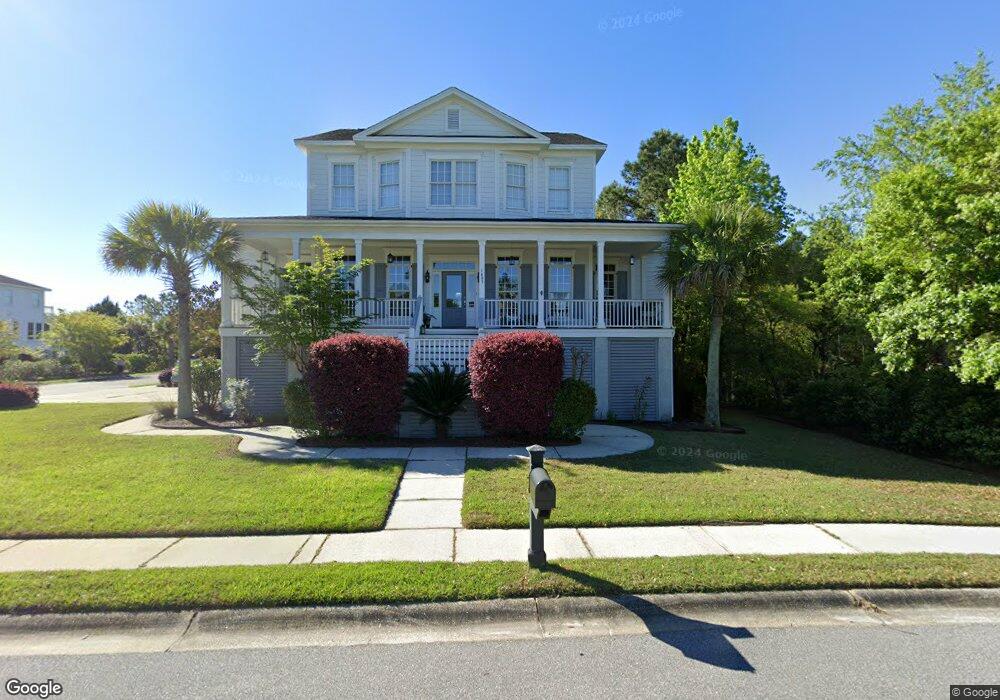
1403 Peach Blossom Ln Charleston, SC 29492
Wando NeighborhoodEstimated Value: $1,162,000 - $1,454,000
5
Beds
4
Baths
3,266
Sq Ft
$388/Sq Ft
Est. Value
About This Home
This home is located at 1403 Peach Blossom Ln, Charleston, SC 29492 and is currently estimated at $1,267,880, approximately $388 per square foot. 1403 Peach Blossom Ln is a home located in Berkeley County.
Ownership History
Date
Name
Owned For
Owner Type
Purchase Details
Closed on
Mar 30, 2006
Sold by
Stono Construction Group Llp
Bought by
Epps Amy R and Epps Elliott F
Current Estimated Value
Home Financials for this Owner
Home Financials are based on the most recent Mortgage that was taken out on this home.
Original Mortgage
$150,000
Interest Rate
6.2%
Mortgage Type
Purchase Money Mortgage
Purchase Details
Closed on
Feb 24, 2005
Sold by
Oswald Edward G
Bought by
Stono Construction Group Llc
Home Financials for this Owner
Home Financials are based on the most recent Mortgage that was taken out on this home.
Original Mortgage
$460,000
Interest Rate
5.61%
Mortgage Type
Purchase Money Mortgage
Purchase Details
Closed on
Jan 19, 2005
Sold by
Southern Lifestyles Ii Llc
Bought by
Oswald Edward G
Home Financials for this Owner
Home Financials are based on the most recent Mortgage that was taken out on this home.
Original Mortgage
$460,000
Interest Rate
5.61%
Mortgage Type
Purchase Money Mortgage
Create a Home Valuation Report for This Property
The Home Valuation Report is an in-depth analysis detailing your home's value as well as a comparison with similar homes in the area
Home Values in the Area
Average Home Value in this Area
Purchase History
| Date | Buyer | Sale Price | Title Company |
|---|---|---|---|
| Epps Amy R | $705,000 | None Available | |
| Stono Construction Group Llc | $120,000 | -- | |
| Oswald Edward G | $79,900 | -- |
Source: Public Records
Mortgage History
| Date | Status | Borrower | Loan Amount |
|---|---|---|---|
| Previous Owner | Epps Amy R | $150,000 | |
| Previous Owner | Stono Construction Group Llc | $460,000 | |
| Previous Owner | Oswald Edward G | $72,904 |
Source: Public Records
Tax History Compared to Growth
Tax History
| Year | Tax Paid | Tax Assessment Tax Assessment Total Assessment is a certain percentage of the fair market value that is determined by local assessors to be the total taxable value of land and additions on the property. | Land | Improvement |
|---|---|---|---|---|
| 2025 | $4,434 | $677,398 | $190,166 | $487,232 |
| 2024 | $4,425 | $27,096 | $7,607 | $19,489 |
| 2023 | $4,425 | $27,096 | $7,607 | $19,489 |
| 2022 | $4,056 | $23,562 | $5,209 | $18,353 |
| 2021 | $4,130 | $23,560 | $5,209 | $18,353 |
| 2020 | $4,213 | $23,562 | $5,209 | $18,353 |
| 2019 | $4,292 | $23,562 | $5,209 | $18,353 |
| 2018 | $3,745 | $20,488 | $3,461 | $17,027 |
| 2017 | $3,739 | $20,488 | $3,461 | $17,027 |
| 2016 | $3,792 | $20,490 | $3,460 | $17,030 |
| 2015 | $3,542 | $20,490 | $3,460 | $17,030 |
| 2014 | $3,538 | $20,490 | $3,460 | $17,030 |
| 2013 | -- | $20,490 | $3,460 | $17,030 |
Source: Public Records
Map
Nearby Homes
- 1212 Winding Creek Ct
- 1191 Rivershore Rd
- 492 Sanders Farm Ln
- 341 Kelsey Blvd
- 330 Kelsey Blvd
- 312 Kelsey Blvd
- 448 Sanders Farm Ln
- 433 Doane Way
- 1017 Rivershore Rd
- 1000 Rivershore Rd
- 263 Kelsey Blvd
- 257 Kelsey Blvd
- 237 Kelsey Blvd
- 402 Topsail Ct
- 224 Kelsey Blvd
- 0 Sols Ln
- 301 Morning Marsh Ln
- 105 Tidewater Way
- 107 Tidewater Way
- 109 Tidewater Way
- 1407 Peach Blossom Ln
- 1145 Rivershore Rd
- 1301 Newport Ct
- 1411 Peach Blossom Ln
- 1153 Rivershore Rd
- 1149 Rivershore
- 1310 Newport Ct
- 1309 Newport Ct
- 1421 Peach Blossom Ln
- 1157 Rivershore Rd
- 752 Winding Creek Ct
- 1317 Newport Ct
- 1202 Winding Creek Ct
- 1301 Blue Sky Ln
- 1701 Newport Ct
- Lot 1b Newport Ct
- Lot 1a Newport Ct
- 1297 Blue Sky Ln
- 1163 Rivershore Rd
- 1170 Rivershore Rd