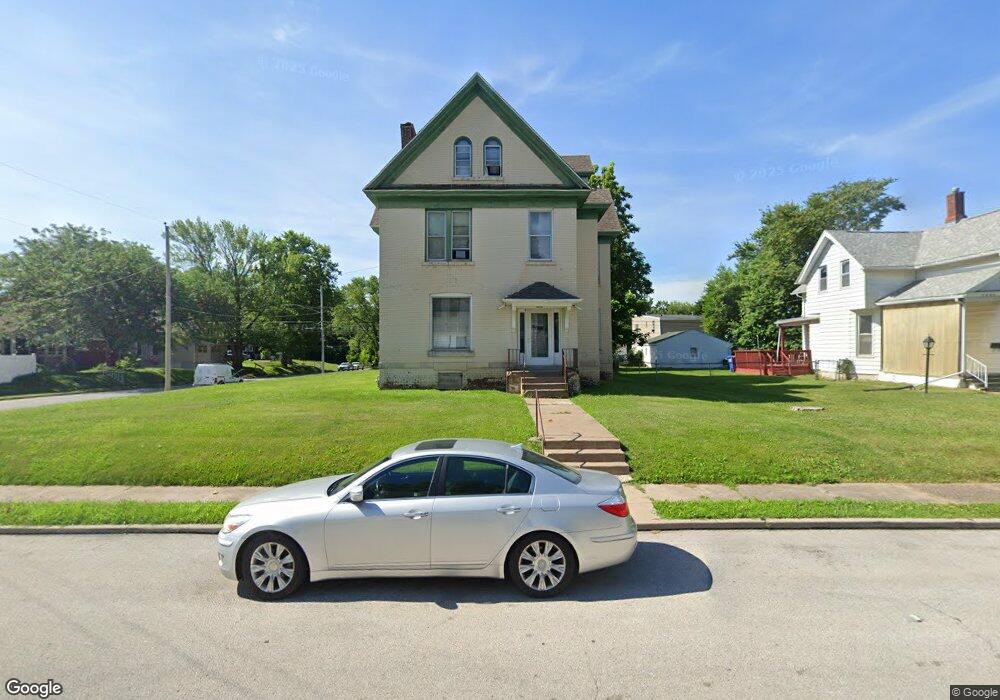
1403 W 13th St Unit 4 Davenport, IA 52804
Northwest Davenport NeighborhoodEstimated Value: $122,000 - $225,000
5
Beds
4
Baths
1
Sq Ft
$160,333/Sq Ft
Est. Value
About This Home
This home is located at 1403 W 13th St Unit 4, Davenport, IA 52804 and is currently estimated at $160,333, approximately $160,333 per square foot. 1403 W 13th St Unit 4 is a home located in Scott County with nearby schools including Walnut Hill Elementary School, Christian County Middle School, and Casey County Middle School.
Ownership History
Date
Name
Owned For
Owner Type
Purchase Details
Closed on
Jun 22, 2011
Sold by
Cornelison Ray A and Cornelison Lisa A
Bought by
Pennywise Investments Llc
Current Estimated Value
Home Financials for this Owner
Home Financials are based on the most recent Mortgage that was taken out on this home.
Original Mortgage
$58,768
Outstanding Balance
$40,513
Interest Rate
4.63%
Mortgage Type
Future Advance Clause Open End Mortgage
Estimated Equity
$119,820
Purchase Details
Closed on
Apr 28, 2006
Sold by
Stahl Howard K and Stahl Fae K
Bought by
Cornelison Ray A and Cornelison Lisa A
Home Financials for this Owner
Home Financials are based on the most recent Mortgage that was taken out on this home.
Original Mortgage
$87,000
Interest Rate
6.42%
Mortgage Type
Commercial
Create a Home Valuation Report for This Property
The Home Valuation Report is an in-depth analysis detailing your home's value as well as a comparison with similar homes in the area
Home Values in the Area
Average Home Value in this Area
Purchase History
| Date | Buyer | Sale Price | Title Company |
|---|---|---|---|
| Pennywise Investments Llc | -- | None Available | |
| Cornelison Ray A | $68,500 | None Available |
Source: Public Records
Mortgage History
| Date | Status | Borrower | Loan Amount |
|---|---|---|---|
| Open | Pennywise Investments Llc | $58,768 | |
| Previous Owner | Cornelison Ray A | $87,000 |
Source: Public Records
Tax History Compared to Growth
Tax History
| Year | Tax Paid | Tax Assessment Tax Assessment Total Assessment is a certain percentage of the fair market value that is determined by local assessors to be the total taxable value of land and additions on the property. | Land | Improvement |
|---|---|---|---|---|
| 2025 | $2,528 | $141,430 | $19,010 | $122,420 |
| 2024 | $2,466 | $141,430 | $19,010 | $122,420 |
| 2023 | $2,178 | $141,430 | $19,010 | $122,420 |
| 2022 | $2,476 | $101,940 | $19,010 | $82,930 |
| 2021 | $2,476 | $97,990 | $19,010 | $78,980 |
| 2020 | $2,754 | $97,990 | $19,010 | $78,980 |
| 2019 | $2,684 | $90,810 | $19,010 | $71,800 |
| 2018 | $2,824 | $90,810 | $19,010 | $71,800 |
| 2017 | $2,992 | $90,810 | $19,010 | $71,800 |
| 2016 | $3,060 | $90,100 | $0 | $0 |
| 2015 | $3,060 | $90,100 | $0 | $0 |
| 2014 | $3,232 | $90,100 | $0 | $0 |
| 2013 | $3,434 | $0 | $0 | $0 |
| 2012 | -- | $90,100 | $15,700 | $74,400 |
Source: Public Records
Map
Nearby Homes
- 1335 W 13th St
- 1321 W 13th St
- 4735 W 12th St
- 1446 Clay St
- 1505 W 14th St
- 1207 N Marquette St
- 1514 N Marquette St
- 1309 Clay St
- 1414 W 9th St
- 1118 W 15th St
- 1034 W 14th St
- 817 N Marquette St
- 1604 W 9th St
- 1419 N Division St
- 930 W 14th St
- 1119 W 8th St
- 1111 W 8th St
- 1445 W 7th St
- 1203 W Locust St
- 903 Vine St
- 1403 W 13th St
- 1407 W 13th St
- 1413 W 13th St
- 1302 N Fillmore St
- 1417 W 13th St
- 1351 W 13th St
- 1221 N Fillmore St
- 1421 W 13th St
- 1421 W 13th St Unit 23
- 1210 N Fillmore St
- 1412 W 13th St
- 1408 W 12th St
- 1410 W 12th St
- 1306 N Fillmore St
- 1213 N Fillmore St
- 1343 W 13th St
- 1418 W 13th St
- 1418 W 12th St
- 1429 W 13th St
- 1424 W 13th St