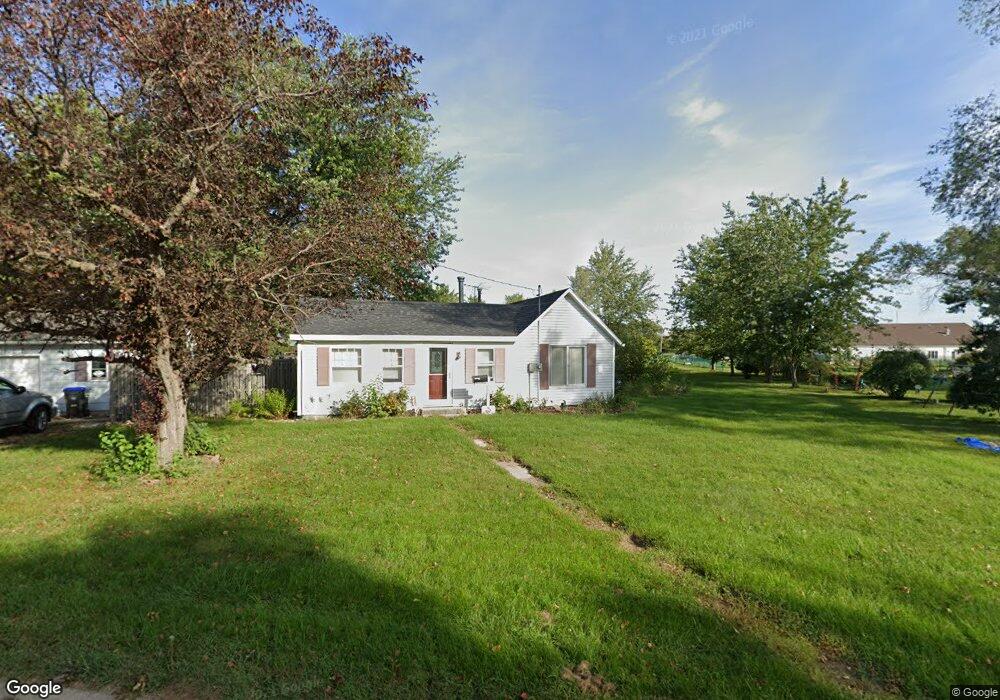
1403 W 3rd St Vinton, IA 52349
Estimated Value: $75,000 - $128,000
2
Beds
1
Bath
746
Sq Ft
$120/Sq Ft
Est. Value
About This Home
This home is located at 1403 W 3rd St, Vinton, IA 52349 and is currently estimated at $89,406, approximately $119 per square foot. 1403 W 3rd St is a home located in Benton County with nearby schools including Tilford Elementary School, Shellsburg Elementary School, and Vinton-Shellsburg Middle School.
Ownership History
Date
Name
Owned For
Owner Type
Purchase Details
Closed on
Jun 16, 2025
Sold by
Pasker Richard J
Bought by
Dh General Contracting Company Llc
Current Estimated Value
Purchase Details
Closed on
Jun 15, 2017
Sold by
Pasker Janine M
Bought by
Pasker Richard J
Purchase Details
Closed on
Dec 18, 2008
Sold by
Garwood Alan W
Bought by
Pasker Richard J
Home Financials for this Owner
Home Financials are based on the most recent Mortgage that was taken out on this home.
Original Mortgage
$63,000
Interest Rate
5.37%
Mortgage Type
Adjustable Rate Mortgage/ARM
Create a Home Valuation Report for This Property
The Home Valuation Report is an in-depth analysis detailing your home's value as well as a comparison with similar homes in the area
Home Values in the Area
Average Home Value in this Area
Purchase History
| Date | Buyer | Sale Price | Title Company |
|---|---|---|---|
| Dh General Contracting Company Llc | $50,000 | None Listed On Document | |
| Pasker Richard J | -- | None Available | |
| Pasker Richard J | $70,000 | None Available |
Source: Public Records
Mortgage History
| Date | Status | Borrower | Loan Amount |
|---|---|---|---|
| Previous Owner | Pasker Richard J | $63,000 |
Source: Public Records
Tax History Compared to Growth
Tax History
| Year | Tax Paid | Tax Assessment Tax Assessment Total Assessment is a certain percentage of the fair market value that is determined by local assessors to be the total taxable value of land and additions on the property. | Land | Improvement |
|---|---|---|---|---|
| 2025 | $1,762 | $112,500 | $31,400 | $81,100 |
| 2024 | $1,762 | $104,300 | $30,000 | $74,300 |
| 2023 | $1,638 | $104,300 | $30,000 | $74,300 |
| 2022 | $1,680 | $85,000 | $24,000 | $61,000 |
| 2021 | $1,680 | $85,000 | $24,000 | $61,000 |
| 2020 | $1,256 | $66,800 | $20,400 | $46,400 |
| 2019 | $1,302 | $66,800 | $20,400 | $46,400 |
| 2018 | $1,260 | $67,900 | $18,500 | $49,400 |
| 2017 | $1,260 | $67,900 | $18,500 | $49,400 |
| 2016 | $1,182 | $63,500 | $17,300 | $46,200 |
| 2015 | $1,182 | $63,500 | $17,300 | $46,200 |
| 2014 | $1,402 | $73,500 | $0 | $0 |
Source: Public Records
Map
Nearby Homes