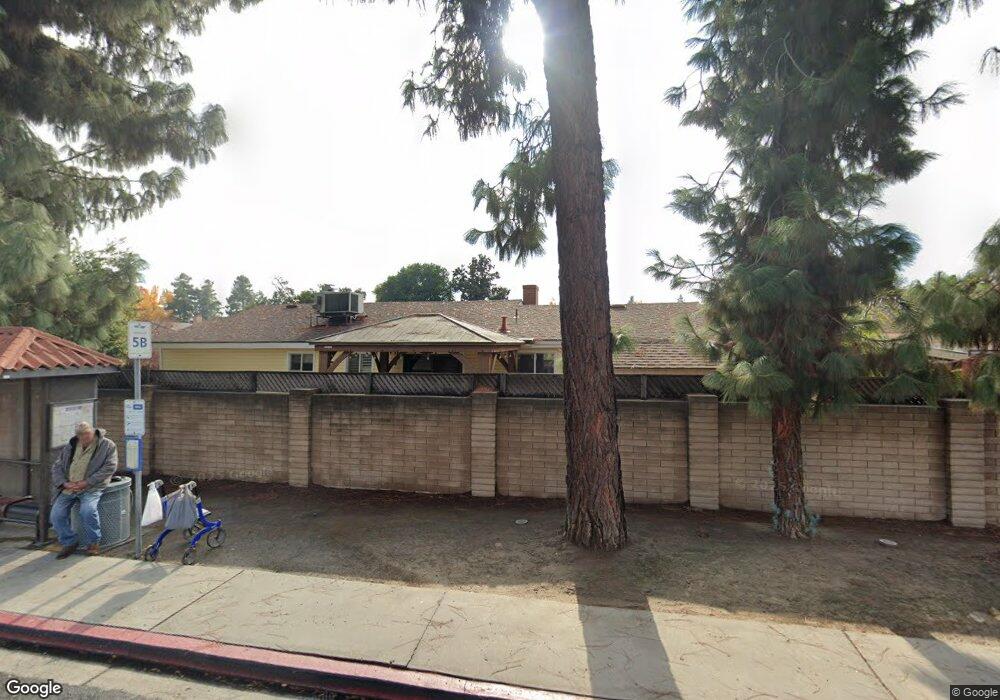
1403 W Walnut Ave Visalia, CA 93277
Mooney NeighborhoodEstimated Value: $258,000 - $280,476
2
Beds
2
Baths
1,068
Sq Ft
$252/Sq Ft
Est. Value
About This Home
This home is located at 1403 W Walnut Ave, Visalia, CA 93277 and is currently estimated at $268,869, approximately $251 per square foot. 1403 W Walnut Ave is a home located in Tulare County with nearby schools including Mountain View Elementary School, Divisadero Middle School, and Mt. Whitney High School.
Ownership History
Date
Name
Owned For
Owner Type
Purchase Details
Closed on
Jun 5, 2017
Sold by
Vreeland Heather M
Bought by
Kramer Heather M
Current Estimated Value
Purchase Details
Closed on
Nov 11, 2009
Sold by
Worsham Gary D
Bought by
Vreeland Heather M
Home Financials for this Owner
Home Financials are based on the most recent Mortgage that was taken out on this home.
Original Mortgage
$122,735
Outstanding Balance
$80,100
Interest Rate
4.99%
Mortgage Type
FHA
Estimated Equity
$188,769
Purchase Details
Closed on
Aug 11, 2006
Sold by
Cone David G
Bought by
Worsham Gary D and Worsham Alfreda K
Home Financials for this Owner
Home Financials are based on the most recent Mortgage that was taken out on this home.
Original Mortgage
$68,250
Interest Rate
6.39%
Mortgage Type
New Conventional
Purchase Details
Closed on
Aug 22, 2005
Sold by
Mitchell William N
Bought by
Cone David G and Cone Karon M
Home Financials for this Owner
Home Financials are based on the most recent Mortgage that was taken out on this home.
Original Mortgage
$150,000
Interest Rate
5.7%
Mortgage Type
Seller Take Back
Create a Home Valuation Report for This Property
The Home Valuation Report is an in-depth analysis detailing your home's value as well as a comparison with similar homes in the area
Home Values in the Area
Average Home Value in this Area
Purchase History
| Date | Buyer | Sale Price | Title Company |
|---|---|---|---|
| Kramer Heather M | -- | Title 365 | |
| Vreeland Heather M | $125,000 | Chicago Title Company | |
| Worsham Gary D | $192,000 | Chicago Title Co | |
| Cone David G | $192,000 | Chicago Title Co |
Source: Public Records
Mortgage History
| Date | Status | Borrower | Loan Amount |
|---|---|---|---|
| Open | Vreeland Heather M | $122,735 | |
| Previous Owner | Worsham Gary D | $36,750 | |
| Previous Owner | Worsham Gary D | $68,250 | |
| Previous Owner | Cone David G | $150,000 |
Source: Public Records
Tax History Compared to Growth
Tax History
| Year | Tax Paid | Tax Assessment Tax Assessment Total Assessment is a certain percentage of the fair market value that is determined by local assessors to be the total taxable value of land and additions on the property. | Land | Improvement |
|---|---|---|---|---|
| 2025 | $1,629 | $161,352 | $45,177 | $116,175 |
| 2024 | $1,629 | $158,190 | $44,292 | $113,898 |
| 2023 | $1,583 | $155,089 | $43,424 | $111,665 |
| 2022 | $1,511 | $152,049 | $42,573 | $109,476 |
| 2021 | $1,511 | $149,067 | $41,738 | $107,329 |
| 2020 | $1,496 | $147,538 | $41,310 | $106,228 |
| 2019 | $1,453 | $144,645 | $40,500 | $104,145 |
| 2018 | $1,353 | $136,000 | $34,000 | $102,000 |
| 2017 | $1,378 | $137,000 | $34,000 | $103,000 |
| 2016 | $1,314 | $131,000 | $33,000 | $98,000 |
| 2015 | $1,088 | $117,000 | $29,000 | $88,000 |
| 2014 | $1,088 | $109,000 | $27,000 | $82,000 |
Source: Public Records
Map
Nearby Homes
- 2013 S Giddings St
- 1134 W Harter Ave
- 1406 W Princeton Ave
- 1640 W Princeton Ct
- 2301 S Divisadero St Unit 9
- 1216 W Evans Ave
- 1009 W Laura Ave
- 1010 W Seeger Ave
- 2301 S Divisadero St Unit 8
- 2111 S Conyer Ct
- 830 W Vassar Ave
- 1608 S Central St
- 705 W Walnut Ave
- 733 W Paradise Ave
- 2738 S Fairway Ct
- 1315 S Conyer St
- 1631 W Monte Vista Ave
- 2110 S Sebastian Ct
- 1700 W La Vida Ave
- 542 W Paradise Ave
- 1405 W Walnut Ave
- 1401 W Walnut Ave
- 1345 W Walnut Ave
- 1423 W Walnut Ave
- 1335 W Walnut Ave
- 1302 W Walnut Ave
- 1443 W Walnut Ave
- 1425 W Walnut Ave
- 1409 W Walnut Ave
- 1421 W Walnut Ct
- 1421 W Walnut Ave
- 1306 W Walnut Ave
- 1417 W Walnut Ave
- 1427 W Walnut Ave
- 1420 W Walnut Ave
- 1419 W Walnut Ave
- 1415 W Walnut Ct
- 1415 W Walnut Ave
- 1411 W Walnut Ave
- 1317 W Walnut Ave